OPEN-SOURCE SCRIPT
Gold/Silver Pairs Scalper
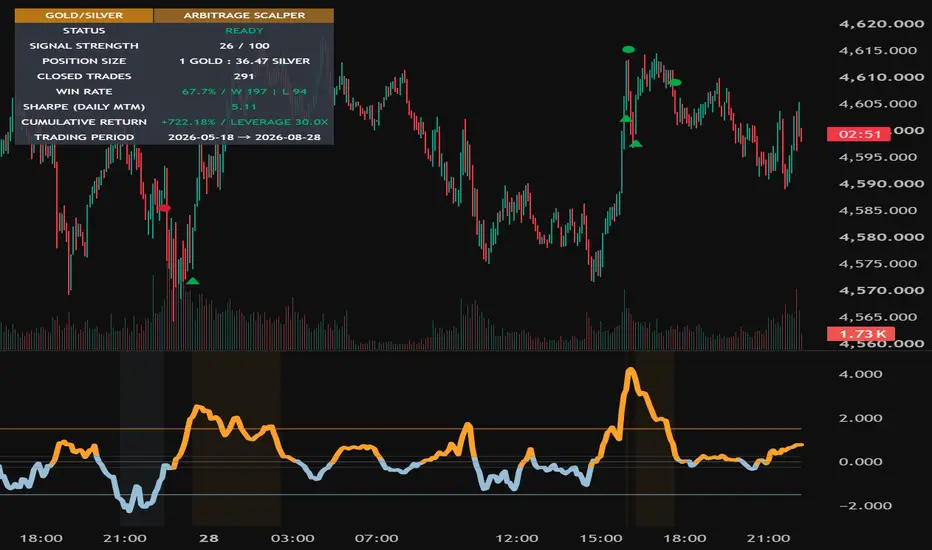
🟢 Gold/Silver Pairs Scalper
Gold/Silver Pairs Scalper identifies temporary relative-value gaps between Gold and Silver and generates market-neutral pair signals:
LONG GOLD / SHORT SILVER
SHORT GOLD / LONG SILVER

It does not predict the outright direction of precious metals. It trades the relative movement between the two assets.
This is statistical arbitrage, not risk-free arbitrage.
🟢 MODEL
Signals are calculated from fixed reference markets:
Gold — OANDA:XAUUSD
Silver — OANDA:XAGUSD
The model combines:
- Beta-adjusted Gold/Silver return divergence
- Gold/Silver price-ratio deviation
- Rolling correlation validation
- Rolling beta hedge sizing
The calculations follow the active chart timeframe.
The recommended timeframes are 3 minutes and 5 minutes.
🟢 GAP SIGNAL
The return gap measures Silver’s movement relative to its expected movement based on Gold:
Return Residual
= Silver Return − Beta × Gold Return
The model also evaluates the Gold/Silver price ratio.
High Gold/Silver ratio → Adds Short Gold / Long Silver pressure
Low Gold/Silver ratio → Adds Long Gold / Short Silver pressure
Both components are standardized and combined into one pair score.
When an extreme gap begins moving back toward its mean:
Positive extreme → LONG GOLD / SHORT SILVER
Negative extreme → SHORT GOLD / LONG SILVER
New positions are allowed only while the Gold/Silver correlation and beta remain valid.
⚖️ POSITION SIZE
The displayed position size adjusts for both the absolute price difference and rolling beta:
1 GOLD : 24.82 SILVER
This is an ounce-equivalent hedge ratio, not a futures contract ratio.
For futures, contract multipliers must be applied separately:
GC — 100 troy ounces
SI — 5,000 troy ounces
Because futures contracts use fixed sizes, the actual hedge may differ from the theoretical ratio after contract rounding.
🔺 SIGNAL MARKERS
Green upward triangle — Long entry
Red downward triangle — Short entry
Green circle — Long exit
Red circle — Short exit
Gold and Silver are managed as one pair position. Both legs enter and exit from the same pair signal.
For example:
Gold chart → Green upward triangle
Silver chart → Red downward triangle
This represents Long Gold / Short Silver.
⏹ EXIT CONDITIONS
The complete pair is closed when:
- The gap returns to the mean-reversion threshold
- The gap expands another 1.25σ against the position
- Correlation or beta becomes invalid
- The position reaches the 100-bar holding limit
- Leveraged pair loss reaches −100%
📊 STATUS
READY (Waiting for a valid entry)
LONG (Current chart asset is long)
SHORT (Current chart asset is short)
WARMUP (Collecting required historical data)
BLOCKED (Correlation or beta is invalid)
COOLDOWN (Waiting briefly after an exit)
LIQUIDATED (Equity reached −100%; trading halted)
LONG and SHORT always describe the asset displayed on the current chart.
During the same pair trade, the Gold chart and Silver chart therefore display opposite directions.
〽️ OSCILLATOR
The lower oscillator displays the final Gold/Silver pair score.
On a Gold chart:
Above zero → Gold
Below zero → Silver
On a Silver chart:
Above zero → Silver
Below zero → Gold
The oscillator is inverted on the Silver chart so its direction corresponds to the active Silver leg.

🖥️ RECOMMENDED LAYOUT
Use a two-chart layout or two separate windows:
Chart 1 — Gold
Chart 2 — Silver
Both charts should use the same 3-minute or 5-minute timeframe.
If only one chart is used, only that asset’s signals are displayed, so the complete Gold/Silver pair trade cannot be followed.
For a synchronized two-chart layout, use:
Symbol OFF
Interval ON
Crosshair ON
Time ON
Date range ON
Keeping Symbol disabled allows one chart to remain on Gold and the other on Silver. The remaining options keep both charts aligned to the same timeframe and time position.
📈 PERFORMANCE
Cumulative Return includes closed-trade results and the unrealized P&L of the active pair position after applying the selected leverage.
Sharpe is calculated from completed UTC daily mark-to-market equity returns. Trading Period runs from the first entry to the latest calculated bar.
Performance is simulated with no commissions, spread, slippage or financing costs, so actual results may differ.
⚠️ DISCLAIMER
This indicator is provided for informational and educational purposes only and does not constitute financial or investment advice.
Historical and simulated performance does not guarantee future results. High leverage can result in rapid and complete loss of capital. All trading decisions remain the sole responsibility of the user.
Gold/Silver Pairs Scalper identifies temporary relative-value gaps between Gold and Silver and generates market-neutral pair signals:
LONG GOLD / SHORT SILVER
SHORT GOLD / LONG SILVER
It does not predict the outright direction of precious metals. It trades the relative movement between the two assets.
This is statistical arbitrage, not risk-free arbitrage.
🟢 MODEL
Signals are calculated from fixed reference markets:
Gold — OANDA:XAUUSD
Silver — OANDA:XAGUSD
The model combines:
- Beta-adjusted Gold/Silver return divergence
- Gold/Silver price-ratio deviation
- Rolling correlation validation
- Rolling beta hedge sizing
The calculations follow the active chart timeframe.
The recommended timeframes are 3 minutes and 5 minutes.
🟢 GAP SIGNAL
The return gap measures Silver’s movement relative to its expected movement based on Gold:
Return Residual
= Silver Return − Beta × Gold Return
The model also evaluates the Gold/Silver price ratio.
High Gold/Silver ratio → Adds Short Gold / Long Silver pressure
Low Gold/Silver ratio → Adds Long Gold / Short Silver pressure
Both components are standardized and combined into one pair score.
When an extreme gap begins moving back toward its mean:
Positive extreme → LONG GOLD / SHORT SILVER
Negative extreme → SHORT GOLD / LONG SILVER
New positions are allowed only while the Gold/Silver correlation and beta remain valid.
⚖️ POSITION SIZE
The displayed position size adjusts for both the absolute price difference and rolling beta:
1 GOLD : 24.82 SILVER
This is an ounce-equivalent hedge ratio, not a futures contract ratio.
For futures, contract multipliers must be applied separately:
GC — 100 troy ounces
SI — 5,000 troy ounces
Because futures contracts use fixed sizes, the actual hedge may differ from the theoretical ratio after contract rounding.
🔺 SIGNAL MARKERS
Green upward triangle — Long entry
Red downward triangle — Short entry
Green circle — Long exit
Red circle — Short exit
Gold and Silver are managed as one pair position. Both legs enter and exit from the same pair signal.
For example:
Gold chart → Green upward triangle
Silver chart → Red downward triangle
This represents Long Gold / Short Silver.
⏹ EXIT CONDITIONS
The complete pair is closed when:
- The gap returns to the mean-reversion threshold
- The gap expands another 1.25σ against the position
- Correlation or beta becomes invalid
- The position reaches the 100-bar holding limit
- Leveraged pair loss reaches −100%
📊 STATUS
READY (Waiting for a valid entry)
LONG (Current chart asset is long)
SHORT (Current chart asset is short)
WARMUP (Collecting required historical data)
BLOCKED (Correlation or beta is invalid)
COOLDOWN (Waiting briefly after an exit)
LIQUIDATED (Equity reached −100%; trading halted)
LONG and SHORT always describe the asset displayed on the current chart.
During the same pair trade, the Gold chart and Silver chart therefore display opposite directions.
〽️ OSCILLATOR
The lower oscillator displays the final Gold/Silver pair score.
On a Gold chart:
Above zero → Gold
Below zero → Silver
On a Silver chart:
Above zero → Silver
Below zero → Gold
The oscillator is inverted on the Silver chart so its direction corresponds to the active Silver leg.
🖥️ RECOMMENDED LAYOUT
Use a two-chart layout or two separate windows:
Chart 1 — Gold
Chart 2 — Silver
Both charts should use the same 3-minute or 5-minute timeframe.
If only one chart is used, only that asset’s signals are displayed, so the complete Gold/Silver pair trade cannot be followed.
For a synchronized two-chart layout, use:
Symbol OFF
Interval ON
Crosshair ON
Time ON
Date range ON
Keeping Symbol disabled allows one chart to remain on Gold and the other on Silver. The remaining options keep both charts aligned to the same timeframe and time position.
📈 PERFORMANCE
Cumulative Return includes closed-trade results and the unrealized P&L of the active pair position after applying the selected leverage.
Sharpe is calculated from completed UTC daily mark-to-market equity returns. Trading Period runs from the first entry to the latest calculated bar.
Performance is simulated with no commissions, spread, slippage or financing costs, so actual results may differ.
⚠️ DISCLAIMER
This indicator is provided for informational and educational purposes only and does not constitute financial or investment advice.
Historical and simulated performance does not guarantee future results. High leverage can result in rapid and complete loss of capital. All trading decisions remain the sole responsibility of the user.
סקריפט קוד פתוח
ברוח האמיתית של TradingView, יוצר הסקריפט הזה הפך אותו לקוד פתוח, כך שסוחרים יוכלו לעיין בו ולאמת את פעולתו. כל הכבוד למחבר! אמנם ניתן להשתמש בו בחינם, אך זכור כי פרסום חוזר של הקוד כפוף ל־כללי הבית שלנו.

כתב ויתור
המידע והפרסומים אינם מיועדים להיות, ואינם מהווים, ייעוץ או המלצה פיננסית, השקעתית, מסחרית או מכל סוג אחר המסופקת או מאושרת על ידי TradingView. קרא עוד ב־תנאי השימוש.
סקריפט קוד פתוח
ברוח האמיתית של TradingView, יוצר הסקריפט הזה הפך אותו לקוד פתוח, כך שסוחרים יוכלו לעיין בו ולאמת את פעולתו. כל הכבוד למחבר! אמנם ניתן להשתמש בו בחינם, אך זכור כי פרסום חוזר של הקוד כפוף ל־כללי הבית שלנו.
כתב ויתור
המידע והפרסומים אינם מיועדים להיות, ואינם מהווים, ייעוץ או המלצה פיננסית, השקעתית, מסחרית או מכל סוג אחר המסופקת או מאושרת על ידי TradingView. קרא עוד ב־תנאי השימוש.