OPEN-SOURCE SCRIPT
Strong Gold Terminal | ProjectSyndicate
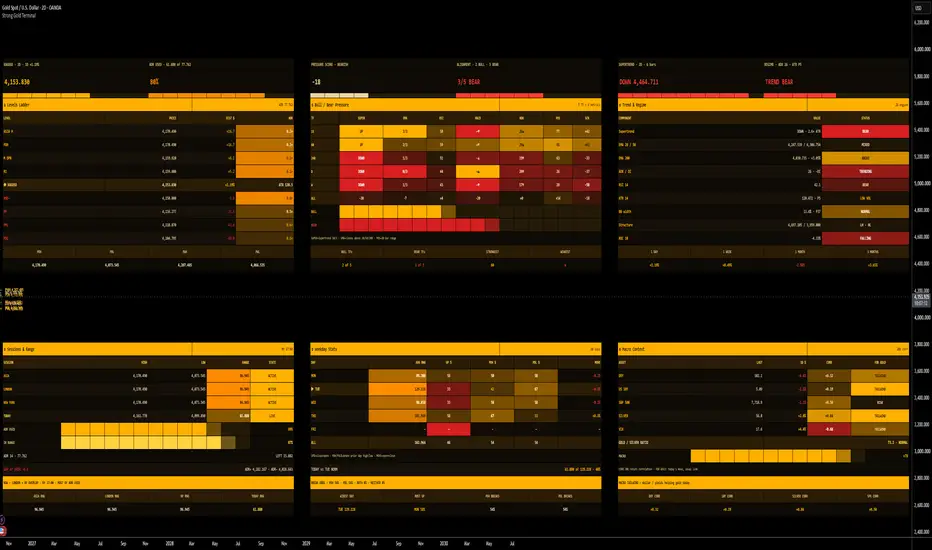
▪️Strong Gold Terminal is a control centre for gold traders that answers the three questions you ask on every bar — where are the levels, which way is the pressure, and what is the context — and puts the answers on the price chart itself, in one compact Bloomberg amber terminal. PDH, PDL, PWH, PWL, PMH, PML, the day / week / month opens, the daily pivots, ADR projections, session highs and lows and the round numbers are all tracked, ranked by distance, and read out with how far each one sits in ATR. "Key level" on its own is a list. This turns it into a sorted ladder that tells you which level price meets next and how much room is between here and there.
▪️Six cards sit on the chart with price still visible between them, and a strip of six gauge tiles runs across the top: price with its daily change, ADR used, the composite bull / bear pressure score, timeframe alignment, Supertrend status and the regime call. Nothing lives in a separate pane and the price scale is never touched. Every chart inside the cards is drawn from fixed-size table cells, so the terminal stays clean on a laptop and on an ultrawide monitor alike, and the whole read is rebuilt on every update so nothing drifts or clips on a live market.
▪️Most "gold dashboard" tools show you a handful of moving averages and a bias word. This one maps trend across five timeframes and six metrics at once, grades the regime, tracks all three trading sessions in New York time against the average daily range, builds a weekday profile from real history, and reads the macro backdrop — dollar, yields, equities, silver, volatility — through gold's usual relationships. It is built for XAUUSD and GC1! but works on any symbol, because every level, session and stat is computed from the chart you are on.
🎯 The Levels Ladder (the core). The first card sorts every key level by distance from price and shows the four nearest above and the four nearest below, with your current price lit white in the middle. Each row carries the level's price, its distance in dollars and its distance in ATR, so you read not just what is near but whether it is one volatility unit away or five. The pool is deep: previous day high / low / close, previous week high / low, previous month high / low, the day / week / month opens, the classic pivot set (PP, R1, R2, S1, S2), the ADR-projected high and low, the Asia / London / New York session highs and lows, and the nearest round numbers above and below. The six core levels, plus the day open, week open and pivot, are also drawn across the chart as labelled lines.
📊 The Bull / Bear Pressure Heatmap. The second card is a five-timeframe by six-metric grid that scores momentum from deep red to amber. The timeframes default to 15m, 1H, 4H, Daily and Weekly, and each one is read on six engines: Supertrend direction, how many of the 20 / 50 / 200 EMAs price sits above, RSI, the MACD histogram and its slope, ADX with DI direction, and position inside the 20-bar range. Every cell is scored from −1 to +1 and coloured by that score. The card totals each metric down the timeframes, totals each timeframe across the metrics, draws a bull bar against a bear bar, and names the strongest and weakest timeframe. Higher timeframes carry more weight in the composite by default, so a weekly flip counts for more than a 15-minute wobble.
🧭 Trend & Regime. The third card is the full trend engine on your chart timeframe. Supertrend level and distance in ATR, the EMA stack (20 / 50 / 200), ADX with DI direction, RSI, ATR with its percentile, Bollinger-band width with its percentile for squeeze detection, market structure from confirmed pivots (HH / HL / LH / LL), and 10-bar rate of change — each with a plain-English status badge. From those it calls the regime: Trend Bull, Trend Bear, Squeeze, Volatile or Range, so you know whether to trade with momentum, fade extremes, or wait for the coil to break. A footer shows the 1-day, 1-week, 1-month and 3-month changes.
🕐 Sessions & Range. The fourth card tracks Asia, London and New York in New York time: each session's high, low, range and state (pending, active or closed), plus today's live range. It shows how much of the average daily range is already spent, where price sits inside today's range, the gap at the open, the ADR projections, and a status line that names which session is live and whether there is room left to run or the day is already stretched past its ADR. All three session windows are adjustable.
📅 Weekday Stats. The fifth card builds a profile from the last 60 completed days (adjustable): for Monday through Friday it shows the average range, the up-close rate, how often the day broke the prior day's high and low, and the average open-to-close move. Today's weekday is marked, today's range is compared with its own weekday norm, and a line reports the PDH / PDL break odds, so you know before London opens whether this is historically a wide trending day or a tight one.
🌐 Macro Context. The sixth card reads the backdrop that moves gold: the Dollar Index, the US 10-year yield, the S&P 500, silver and the VIX, each with its last price, 1-day change, and 20-day return correlation to gold. Each one is tagged tailwind, headwind or neutral through its usual relationship with gold, a composite macro bar sums them into one read, and the gold / silver ratio is shown with a cheap / rich tag. The macro symbols are inputs, so you can swap any of them for the feed your plan supports.
📋 Bloomberg Amber Terminal. Black terminal background, amber headline strips, bold monospaced figures, a diverging red-through-dark-to-amber scale for the pressure and trend cells, a sequential brown-through-orange-to-red scale for range and drawdown heat, white for your current price, and gutters that match your chart background automatically. Three cards sit across the top and three across the bottom, with price in between. A top offset keeps the symbol legend clear of the titles and a bottom offset keeps the chart logo clear, both adjustable.
🔔 Native Alerts.
Break Above PDH / Break Below PDL — price closes through the previous day's high or low.
Break Above PWH / Break Below PWL — price closes through the previous week's high or low.
Supertrend Flip Up / Down — the chart-timeframe Supertrend changes direction.
Strong Bull / Bear Pressure — the composite pressure score crosses ±40.
ADR Exhausted — today's range reaches the average daily range.
🔧 Fully Customizable. Round-number step and ADR length; whether the levels and opens draw on the chart and how long the lines run; the three session windows and their time zone; the five pressure timeframes and whether higher timeframes are weighted more; Supertrend period and factor, the three EMA lengths, ADX / RSI / ATR lengths, the percentile lookback and the structure pivot strength; the weekday sample size; all five macro symbols and the correlation window; each of the six cards on or off; and full display sizing — cell width, row and KPI heights, three text sizes, top and bottom offsets, and gutter colour.
🎯 Why this is different. A levels tool draws a grid and stops. A dashboard tool prints a bias word with no evidence behind it. This one sorts every level by distance and volatility so you always know what price meets next, grades momentum across five timeframes and six metrics instead of one, separates the three sessions and measures them against the ADR, builds a real weekday profile from history, and reads the macro backdrop through gold's actual relationships — all on the chart, with the price scale untouched, rebuilt live on every bar.
🚀 Built for gold. XAUUSD and GC1! are the home market, but the round-number step, session windows, ADR length and macro symbols are all inputs, so the terminal adapts to silver, indices, FX and anything else that trades around levels and sessions. Set the round step to match the instrument (50 for gold, 1,000 for BTC, 0.01 for FX) and the rest follows.
💡 Cleanest setup: run it on a 5m–1H chart so the sessions, ADR and weekday stats have enough bars, keep all six cards on for the full control centre or switch off the ones you don't need, and give the correlation window and weekday sample a few days of history to fill. On very high timeframes raise the round-number step so single candles don't swallow several levels.
🎯 How To Use It: Two Approaches
Everything comes down to two reads: where is price relative to the levels, and is the pressure behind it or against it.
🧱 1) Trade the level with the pressure behind it
Use this when price is approaching a level from the Levels Ladder.
▪️Read the ladder. The nearest level above or below, and its distance in ATR, tells you the target and whether there is room to reach it before the next obstacle. A level less than half an ATR away is not a trade; a clear ATR of space is.
▪️Confirm the pressure. Check the Bull / Bear Pressure card and the Trend & Regime call. Price pushing into resistance with strong bull pressure across the higher timeframes and a Trend Bull regime is a continuation setup; price into support with bear pressure is the short mirror.
Trigger: the break or the rejection at the level, in the direction the pressure and regime agree on.
Target: the next level up the ladder, sized against its ATR distance.
Stand aside: when pressure and price disagree — strong bear pressure into support is a bounce to fade, not a breakout to chase.
⚡ 2) Trade the session and the range
Use this when you are timing an entry inside the day.
▪️Read the clock. The Sessions & Range card names the live session and shows how much of the ADR is already spent. Early in London with most of the ADR still available is room to run; late in New York with the range already past its ADR is mean-reversion territory, not breakout.
▪️Read the day. The Weekday Stats card tells you whether today is historically a wide trending weekday or a tight one, and today's range against its own weekday norm tells you if the move is already overextended for this day of the week.
Trigger: a session high / low break when the ADR still has room, or a fade back toward the open when the range is spent and the macro backdrop is neutral.
Watch: the macro card. A strong dollar or yield headwind on the day argues against chasing gold longs, however good the level looks.
✋ Stand down: when the terminal says wait
A Range or Squeeze regime with pressure near zero: no edge in either direction yet.
Price between levels with the nearest one more than a couple of ATR away: no level to trade against.
Most of the ADR already spent with the session late: the easy move is gone.
A macro headwind pulling against your direction: the context is fighting the setup.
Timeframes split roughly even on the pressure card: wait for alignment.
Rule of thumb: 🧱 Clear level ahead + pressure and regime agreeing + ADR room left → trade in the pressure's direction toward the next level. ⚡ Live session early + wide weekday + macro tailwind → favour continuation; late session + spent ADR + neutral macro → favour the fade. ❄️ Range regime, pressure near zero, ADR spent, or macro against you → stand down until the terminal lines up.
⚠️ IMPORTANT NOTICE: Strong Gold Terminal [Bloomberg] is an analysis and context tool, not a signal service or a promise that any level will react. The levels, pressure scores, regime calls, session stats, weekday profile and macro reads are descriptions of what price and the market have done, computed from the bars and history available on your chart and feed. They describe behaviour, not obligation. Correlations and weekday statistics need history to build and will read "—" until they have it; macro rows depend on the symbols your data plan supplies. Supertrend, structure and the pressure cells update on the live bar and a reading can change until that bar closes. This is decision support, not a trade trigger or financial advice. Always combine it with your own strategy, testing and risk management. Past behaviour does not guarantee future behaviour.
▪️Six cards sit on the chart with price still visible between them, and a strip of six gauge tiles runs across the top: price with its daily change, ADR used, the composite bull / bear pressure score, timeframe alignment, Supertrend status and the regime call. Nothing lives in a separate pane and the price scale is never touched. Every chart inside the cards is drawn from fixed-size table cells, so the terminal stays clean on a laptop and on an ultrawide monitor alike, and the whole read is rebuilt on every update so nothing drifts or clips on a live market.
▪️Most "gold dashboard" tools show you a handful of moving averages and a bias word. This one maps trend across five timeframes and six metrics at once, grades the regime, tracks all three trading sessions in New York time against the average daily range, builds a weekday profile from real history, and reads the macro backdrop — dollar, yields, equities, silver, volatility — through gold's usual relationships. It is built for XAUUSD and GC1! but works on any symbol, because every level, session and stat is computed from the chart you are on.
🎯 The Levels Ladder (the core). The first card sorts every key level by distance from price and shows the four nearest above and the four nearest below, with your current price lit white in the middle. Each row carries the level's price, its distance in dollars and its distance in ATR, so you read not just what is near but whether it is one volatility unit away or five. The pool is deep: previous day high / low / close, previous week high / low, previous month high / low, the day / week / month opens, the classic pivot set (PP, R1, R2, S1, S2), the ADR-projected high and low, the Asia / London / New York session highs and lows, and the nearest round numbers above and below. The six core levels, plus the day open, week open and pivot, are also drawn across the chart as labelled lines.
📊 The Bull / Bear Pressure Heatmap. The second card is a five-timeframe by six-metric grid that scores momentum from deep red to amber. The timeframes default to 15m, 1H, 4H, Daily and Weekly, and each one is read on six engines: Supertrend direction, how many of the 20 / 50 / 200 EMAs price sits above, RSI, the MACD histogram and its slope, ADX with DI direction, and position inside the 20-bar range. Every cell is scored from −1 to +1 and coloured by that score. The card totals each metric down the timeframes, totals each timeframe across the metrics, draws a bull bar against a bear bar, and names the strongest and weakest timeframe. Higher timeframes carry more weight in the composite by default, so a weekly flip counts for more than a 15-minute wobble.
🧭 Trend & Regime. The third card is the full trend engine on your chart timeframe. Supertrend level and distance in ATR, the EMA stack (20 / 50 / 200), ADX with DI direction, RSI, ATR with its percentile, Bollinger-band width with its percentile for squeeze detection, market structure from confirmed pivots (HH / HL / LH / LL), and 10-bar rate of change — each with a plain-English status badge. From those it calls the regime: Trend Bull, Trend Bear, Squeeze, Volatile or Range, so you know whether to trade with momentum, fade extremes, or wait for the coil to break. A footer shows the 1-day, 1-week, 1-month and 3-month changes.
🕐 Sessions & Range. The fourth card tracks Asia, London and New York in New York time: each session's high, low, range and state (pending, active or closed), plus today's live range. It shows how much of the average daily range is already spent, where price sits inside today's range, the gap at the open, the ADR projections, and a status line that names which session is live and whether there is room left to run or the day is already stretched past its ADR. All three session windows are adjustable.
📅 Weekday Stats. The fifth card builds a profile from the last 60 completed days (adjustable): for Monday through Friday it shows the average range, the up-close rate, how often the day broke the prior day's high and low, and the average open-to-close move. Today's weekday is marked, today's range is compared with its own weekday norm, and a line reports the PDH / PDL break odds, so you know before London opens whether this is historically a wide trending day or a tight one.
🌐 Macro Context. The sixth card reads the backdrop that moves gold: the Dollar Index, the US 10-year yield, the S&P 500, silver and the VIX, each with its last price, 1-day change, and 20-day return correlation to gold. Each one is tagged tailwind, headwind or neutral through its usual relationship with gold, a composite macro bar sums them into one read, and the gold / silver ratio is shown with a cheap / rich tag. The macro symbols are inputs, so you can swap any of them for the feed your plan supports.
📋 Bloomberg Amber Terminal. Black terminal background, amber headline strips, bold monospaced figures, a diverging red-through-dark-to-amber scale for the pressure and trend cells, a sequential brown-through-orange-to-red scale for range and drawdown heat, white for your current price, and gutters that match your chart background automatically. Three cards sit across the top and three across the bottom, with price in between. A top offset keeps the symbol legend clear of the titles and a bottom offset keeps the chart logo clear, both adjustable.
🔔 Native Alerts.
Break Above PDH / Break Below PDL — price closes through the previous day's high or low.
Break Above PWH / Break Below PWL — price closes through the previous week's high or low.
Supertrend Flip Up / Down — the chart-timeframe Supertrend changes direction.
Strong Bull / Bear Pressure — the composite pressure score crosses ±40.
ADR Exhausted — today's range reaches the average daily range.
🔧 Fully Customizable. Round-number step and ADR length; whether the levels and opens draw on the chart and how long the lines run; the three session windows and their time zone; the five pressure timeframes and whether higher timeframes are weighted more; Supertrend period and factor, the three EMA lengths, ADX / RSI / ATR lengths, the percentile lookback and the structure pivot strength; the weekday sample size; all five macro symbols and the correlation window; each of the six cards on or off; and full display sizing — cell width, row and KPI heights, three text sizes, top and bottom offsets, and gutter colour.
🎯 Why this is different. A levels tool draws a grid and stops. A dashboard tool prints a bias word with no evidence behind it. This one sorts every level by distance and volatility so you always know what price meets next, grades momentum across five timeframes and six metrics instead of one, separates the three sessions and measures them against the ADR, builds a real weekday profile from history, and reads the macro backdrop through gold's actual relationships — all on the chart, with the price scale untouched, rebuilt live on every bar.
🚀 Built for gold. XAUUSD and GC1! are the home market, but the round-number step, session windows, ADR length and macro symbols are all inputs, so the terminal adapts to silver, indices, FX and anything else that trades around levels and sessions. Set the round step to match the instrument (50 for gold, 1,000 for BTC, 0.01 for FX) and the rest follows.
💡 Cleanest setup: run it on a 5m–1H chart so the sessions, ADR and weekday stats have enough bars, keep all six cards on for the full control centre or switch off the ones you don't need, and give the correlation window and weekday sample a few days of history to fill. On very high timeframes raise the round-number step so single candles don't swallow several levels.
🎯 How To Use It: Two Approaches
Everything comes down to two reads: where is price relative to the levels, and is the pressure behind it or against it.
🧱 1) Trade the level with the pressure behind it
Use this when price is approaching a level from the Levels Ladder.
▪️Read the ladder. The nearest level above or below, and its distance in ATR, tells you the target and whether there is room to reach it before the next obstacle. A level less than half an ATR away is not a trade; a clear ATR of space is.
▪️Confirm the pressure. Check the Bull / Bear Pressure card and the Trend & Regime call. Price pushing into resistance with strong bull pressure across the higher timeframes and a Trend Bull regime is a continuation setup; price into support with bear pressure is the short mirror.
Trigger: the break or the rejection at the level, in the direction the pressure and regime agree on.
Target: the next level up the ladder, sized against its ATR distance.
Stand aside: when pressure and price disagree — strong bear pressure into support is a bounce to fade, not a breakout to chase.
⚡ 2) Trade the session and the range
Use this when you are timing an entry inside the day.
▪️Read the clock. The Sessions & Range card names the live session and shows how much of the ADR is already spent. Early in London with most of the ADR still available is room to run; late in New York with the range already past its ADR is mean-reversion territory, not breakout.
▪️Read the day. The Weekday Stats card tells you whether today is historically a wide trending weekday or a tight one, and today's range against its own weekday norm tells you if the move is already overextended for this day of the week.
Trigger: a session high / low break when the ADR still has room, or a fade back toward the open when the range is spent and the macro backdrop is neutral.
Watch: the macro card. A strong dollar or yield headwind on the day argues against chasing gold longs, however good the level looks.
✋ Stand down: when the terminal says wait
A Range or Squeeze regime with pressure near zero: no edge in either direction yet.
Price between levels with the nearest one more than a couple of ATR away: no level to trade against.
Most of the ADR already spent with the session late: the easy move is gone.
A macro headwind pulling against your direction: the context is fighting the setup.
Timeframes split roughly even on the pressure card: wait for alignment.
Rule of thumb: 🧱 Clear level ahead + pressure and regime agreeing + ADR room left → trade in the pressure's direction toward the next level. ⚡ Live session early + wide weekday + macro tailwind → favour continuation; late session + spent ADR + neutral macro → favour the fade. ❄️ Range regime, pressure near zero, ADR spent, or macro against you → stand down until the terminal lines up.
⚠️ IMPORTANT NOTICE: Strong Gold Terminal [Bloomberg] is an analysis and context tool, not a signal service or a promise that any level will react. The levels, pressure scores, regime calls, session stats, weekday profile and macro reads are descriptions of what price and the market have done, computed from the bars and history available on your chart and feed. They describe behaviour, not obligation. Correlations and weekday statistics need history to build and will read "—" until they have it; macro rows depend on the symbols your data plan supplies. Supertrend, structure and the pressure cells update on the live bar and a reading can change until that bar closes. This is decision support, not a trade trigger or financial advice. Always combine it with your own strategy, testing and risk management. Past behaviour does not guarantee future behaviour.
סקריפט קוד פתוח
ברוח האמיתית של TradingView, יוצר הסקריפט הזה הפך אותו לקוד פתוח, כך שסוחרים יוכלו לעיין בו ולאמת את פעולתו. כל הכבוד למחבר! אמנם ניתן להשתמש בו בחינם, אך זכור כי פרסום חוזר של הקוד כפוף ל־כללי הבית שלנו.

Gold Algo Trading · +1100% YTD · max DD <5%
Syndicate Ultimate · 5 algo systems · 1 bundle
1 payment · lifetime access · no monthly fees
+ FX · NQ/ES · 10+ yr institutional desk
syndicate001.com
Join on Telegram
t.me/aisyndicate001
Syndicate Ultimate · 5 algo systems · 1 bundle
1 payment · lifetime access · no monthly fees
+ FX · NQ/ES · 10+ yr institutional desk
syndicate001.com
Join on Telegram
t.me/aisyndicate001
כתב ויתור
המידע והפרסומים אינם מיועדים להיות, ואינם מהווים, ייעוץ או המלצה פיננסית, השקעתית, מסחרית או מכל סוג אחר המסופקת או מאושרת על ידי TradingView. קרא עוד ב־תנאי השימוש.
סקריפט קוד פתוח
ברוח האמיתית של TradingView, יוצר הסקריפט הזה הפך אותו לקוד פתוח, כך שסוחרים יוכלו לעיין בו ולאמת את פעולתו. כל הכבוד למחבר! אמנם ניתן להשתמש בו בחינם, אך זכור כי פרסום חוזר של הקוד כפוף ל־כללי הבית שלנו.
Gold Algo Trading · +1100% YTD · max DD <5%
Syndicate Ultimate · 5 algo systems · 1 bundle
1 payment · lifetime access · no monthly fees
+ FX · NQ/ES · 10+ yr institutional desk
syndicate001.com
Join on Telegram
t.me/aisyndicate001
Syndicate Ultimate · 5 algo systems · 1 bundle
1 payment · lifetime access · no monthly fees
+ FX · NQ/ES · 10+ yr institutional desk
syndicate001.com
Join on Telegram
t.me/aisyndicate001
כתב ויתור
המידע והפרסומים אינם מיועדים להיות, ואינם מהווים, ייעוץ או המלצה פיננסית, השקעתית, מסחרית או מכל סוג אחר המסופקת או מאושרת על ידי TradingView. קרא עוד ב־תנאי השימוש.