FX Pip Stats Dashboard
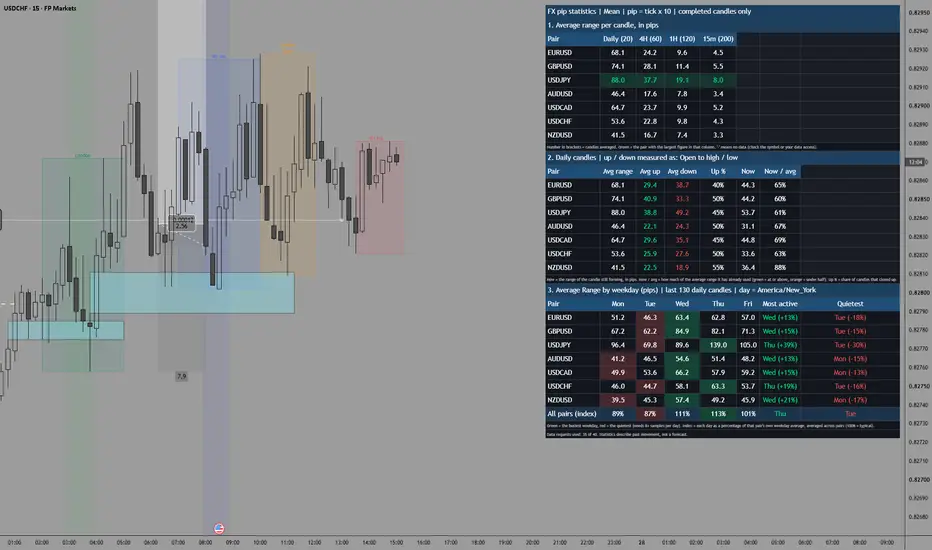
What it shows
Table 1: average pips by timeframe. Each row is a pair and each column is a timeframe. Four timeframe slots are available (daily, 4H, 1H and 15m by default). You can change any of them and turn each on or off. The Table 1 Shows setting picks what the cells contain:
Average range (high to low).
Average up pips.
Average down pips.
Share of candles that closed up.
The pair with the largest figure in each column is highlighted.
Table 2: range, up and down together. For one timeframe slot you choose, this lists average range, average up, average down, the share of up candles, and how much of the average range the current candle has already used. For example, “Now / avg 120%” on the daily means today has already moved more than the typical day.
Table 3: busiest weekdays. For each pair, this gives the average daily range (or up or down move) for Monday to Friday over the last 130 daily candles. The busiest day is green and the quietest is red. The last two columns name them and show how far they sit from that pair’s own average. A bottom row combines all pairs by showing each day as a percentage of that pair’s own average, so JPY pairs and EUR pairs can be compared fairly.
How “up” and “down” are measured
You choose in the settings, because the term is ambiguous:
Open to high / low (default): up is how far price traded above the open, and down is how far below the open. It describes the typical travel in each direction, whatever colour the candle ends up.
Candle body: the average body of candles that closed up, and the average body of candles that closed down.
Candle range: the average high-to-low range of up candles and of down candles.
The average type can be mean or median. Median is less affected by news spikes, so for a typical day it is usually the better figure. It applies to the range and to the open-to-high/low option.
Things to keep in mind
Request limit. TradingView allows 40 data requests per script, and each enabled pair uses one per timeframe plus one for the weekday table. The default (7 pairs, 4 timeframes, weekdays on) uses 35. If you hit the limit, turn off a timeframe or a pair. The footer shows how many you’re using.
Pip size. Pips are the minimum tick times 10, which suits most forex pairs. For other instruments or feeds that quote pips differently, change the multiplier.
Weekday sample size. 26 weeks gives about 26 samples per weekday. Differences of 5 to 10 percent between days are mostly noise. A consistent gap of 20 percent or more, or one that shows up across many pairs, is more meaningful.
Weekday labelling. A daily candle is labelled with the weekday it closes on. Keep the time zone in the Americas or Europe, otherwise Monday’s candle can be labelled Tuesday.
Data depth. Short lookbacks on very low timeframes cover only a few hours or days. Increase the number of candles if the figures swing a lot.
Average range is not a target. Ranges include spikes and the quiet hours of the day. Check the median alongside the mean before using any figure to size stops or targets.
This is a statistics dashboard, not a trade signal, and I’m not a financial advisor.
Table 1: average pips by timeframe. Each row is a pair and each column is a timeframe. Four timeframe slots are available (daily, 4H, 1H and 15m by default). You can change any of them and turn each on or off. The Table 1 Shows setting picks what the cells contain:
Average range (high to low).
Average up pips.
Average down pips.
Share of candles that closed up.
The pair with the largest figure in each column is highlighted.
Table 2: range, up and down together. For one timeframe slot you choose, this lists average range, average up, average down, the share of up candles, and how much of the average range the current candle has already used. For example, “Now / avg 120%” on the daily means today has already moved more than the typical day.
Table 3: busiest weekdays. For each pair, this gives the average daily range (or up or down move) for Monday to Friday over the last 130 daily candles. The busiest day is green and the quietest is red. The last two columns name them and show how far they sit from that pair’s own average. A bottom row combines all pairs by showing each day as a percentage of that pair’s own average, so JPY pairs and EUR pairs can be compared fairly.
How “up” and “down” are measured
You choose in the settings, because the term is ambiguous:
Open to high / low (default): up is how far price traded above the open, and down is how far below the open. It describes the typical travel in each direction, whatever colour the candle ends up.
Candle body: the average body of candles that closed up, and the average body of candles that closed down.
Candle range: the average high-to-low range of up candles and of down candles.
The average type can be mean or median. Median is less affected by news spikes, so for a typical day it is usually the better figure. It applies to the range and to the open-to-high/low option.
Things to keep in mind
Request limit. TradingView allows 40 data requests per script, and each enabled pair uses one per timeframe plus one for the weekday table. The default (7 pairs, 4 timeframes, weekdays on) uses 35. If you hit the limit, turn off a timeframe or a pair. The footer shows how many you’re using.
Pip size. Pips are the minimum tick times 10, which suits most forex pairs. For other instruments or feeds that quote pips differently, change the multiplier.
Weekday sample size. 26 weeks gives about 26 samples per weekday. Differences of 5 to 10 percent between days are mostly noise. A consistent gap of 20 percent or more, or one that shows up across many pairs, is more meaningful.
Weekday labelling. A daily candle is labelled with the weekday it closes on. Keep the time zone in the Americas or Europe, otherwise Monday’s candle can be labelled Tuesday.
Data depth. Short lookbacks on very low timeframes cover only a few hours or days. Increase the number of candles if the figures swing a lot.
Average range is not a target. Ranges include spikes and the quiet hours of the day. Check the median alongside the mean before using any figure to size stops or targets.
This is a statistics dashboard, not a trade signal, and I’m not a financial advisor.

כתב ויתור
המידע והפרסומים אינם מיועדים להיות, ואינם מהווים, ייעוץ או המלצה פיננסית, השקעתית, מסחרית או מכל סוג אחר המסופקת או מאושרת על ידי TradingView. קרא עוד ב־תנאי השימוש.
כתב ויתור
המידע והפרסומים אינם מיועדים להיות, ואינם מהווים, ייעוץ או המלצה פיננסית, השקעתית, מסחרית או מכל סוג אחר המסופקת או מאושרת על ידי TradingView. קרא עוד ב־תנאי השימוש.