Strat Bars + Bias (multi-timeframe)
Summary
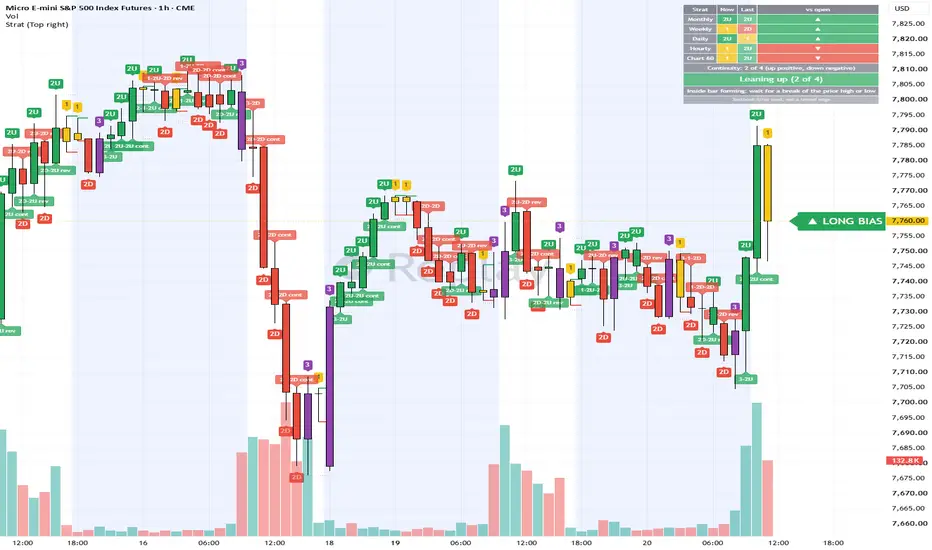
Labels every bar using The Strat’s bar types and shows monthly, weekly, daily and hourly continuity in one table. It draws inside-bar trigger lines and gives a rule-based bias arrow.
What it does
Bar labels and colors: every bar is classified relative to the one before it and labeled.
1 (inside, yellow): stays within the prior bar’s high and low.
2U (green): breaks only the prior high.
2D (red): breaks only the prior low.
3 (outside, purple): breaks both.
Pattern labels: marks common two- and three-bar combinations when the bar closes, including 2-1-2 (continuation and reversal), 3-1-2, 1-2-2, 2U-2D and 2D-2U reversals, 2-2 continuations, and 3-2U / 3-2D.
Inside-bar triggers: when an inside bar closes, it draws a green line at the bar’s high (long trigger) and a red line at its low (short trigger). Dotted lines mark the prior bar’s high and low as the first targets. The lines stop when the inside bar breaks.
Multi-timeframe table: for Monthly, Weekly, Daily, Hourly and your chart’s timeframe, it shows the current bar’s type, the last completed bar’s type, and whether price is above or below that bar’s open (▲ / ▼). It also gives a continuity score from −4 to +4.
Bias arrow: a label on the last bar reads “LONG BIAS” or “SHORT BIAS” when at least 3 of the 4 higher timeframes agree, and “WAIT” otherwise. When all four agree, the table says full time frame continuity up or down.
Plain-English read: a line in the table describes what the current bar sequence means, for example “2U: prior high broken, up bias. Turns to a reversal if the prior low breaks.”
How to use it
Add it to a chart of 1 hour or shorter. The hourly, daily, weekly and monthly rows are drawn from the chart’s symbol.
Look at the continuity score and bias arrow for direction, then wait for an inside bar to arm. Take the break of its high or low in the direction the continuity favors.
Use the dotted target lines as a reference for where the move might first stall.
Settings: label bars, color bars, pattern labels, trigger lines, table, bias arrow, table position, and the colors for each bar type.
Notes and limits
The bias is the textbook Strat reading, not a tested edge.
Bar types depend on the chart’s session settings. Futures with extended hours will classify differently from regular-hours charts.
The “current bar” values on the higher timeframes update in real time, so a bar can change type until it closes.
The Strat was created by Rob Smith. This script applies the commonly taught bar definitions and is not affiliated with him.
Disclaimer: For education and charting only. This is not financial advice. Trading futures and options involves substantial risk of loss.
Labels every bar using The Strat’s bar types and shows monthly, weekly, daily and hourly continuity in one table. It draws inside-bar trigger lines and gives a rule-based bias arrow.
What it does
Bar labels and colors: every bar is classified relative to the one before it and labeled.
1 (inside, yellow): stays within the prior bar’s high and low.
2U (green): breaks only the prior high.
2D (red): breaks only the prior low.
3 (outside, purple): breaks both.
Pattern labels: marks common two- and three-bar combinations when the bar closes, including 2-1-2 (continuation and reversal), 3-1-2, 1-2-2, 2U-2D and 2D-2U reversals, 2-2 continuations, and 3-2U / 3-2D.
Inside-bar triggers: when an inside bar closes, it draws a green line at the bar’s high (long trigger) and a red line at its low (short trigger). Dotted lines mark the prior bar’s high and low as the first targets. The lines stop when the inside bar breaks.
Multi-timeframe table: for Monthly, Weekly, Daily, Hourly and your chart’s timeframe, it shows the current bar’s type, the last completed bar’s type, and whether price is above or below that bar’s open (▲ / ▼). It also gives a continuity score from −4 to +4.
Bias arrow: a label on the last bar reads “LONG BIAS” or “SHORT BIAS” when at least 3 of the 4 higher timeframes agree, and “WAIT” otherwise. When all four agree, the table says full time frame continuity up or down.
Plain-English read: a line in the table describes what the current bar sequence means, for example “2U: prior high broken, up bias. Turns to a reversal if the prior low breaks.”
How to use it
Add it to a chart of 1 hour or shorter. The hourly, daily, weekly and monthly rows are drawn from the chart’s symbol.
Look at the continuity score and bias arrow for direction, then wait for an inside bar to arm. Take the break of its high or low in the direction the continuity favors.
Use the dotted target lines as a reference for where the move might first stall.
Settings: label bars, color bars, pattern labels, trigger lines, table, bias arrow, table position, and the colors for each bar type.
Notes and limits
The bias is the textbook Strat reading, not a tested edge.
Bar types depend on the chart’s session settings. Futures with extended hours will classify differently from regular-hours charts.
The “current bar” values on the higher timeframes update in real time, so a bar can change type until it closes.
The Strat was created by Rob Smith. This script applies the commonly taught bar definitions and is not affiliated with him.
Disclaimer: For education and charting only. This is not financial advice. Trading futures and options involves substantial risk of loss.

כתב ויתור
המידע והפרסומים אינם מיועדים להיות, ואינם מהווים, ייעוץ או המלצה פיננסית, השקעתית, מסחרית או מכל סוג אחר המסופקת או מאושרת על ידי TradingView. קרא עוד ב־תנאי השימוש.
כתב ויתור
המידע והפרסומים אינם מיועדים להיות, ואינם מהווים, ייעוץ או המלצה פיננסית, השקעתית, מסחרית או מכל סוג אחר המסופקת או מאושרת על ידי TradingView. קרא עוד ב־תנאי השימוש.