OPEN-SOURCE SCRIPT
Vector Candle 50% Real Body Levels
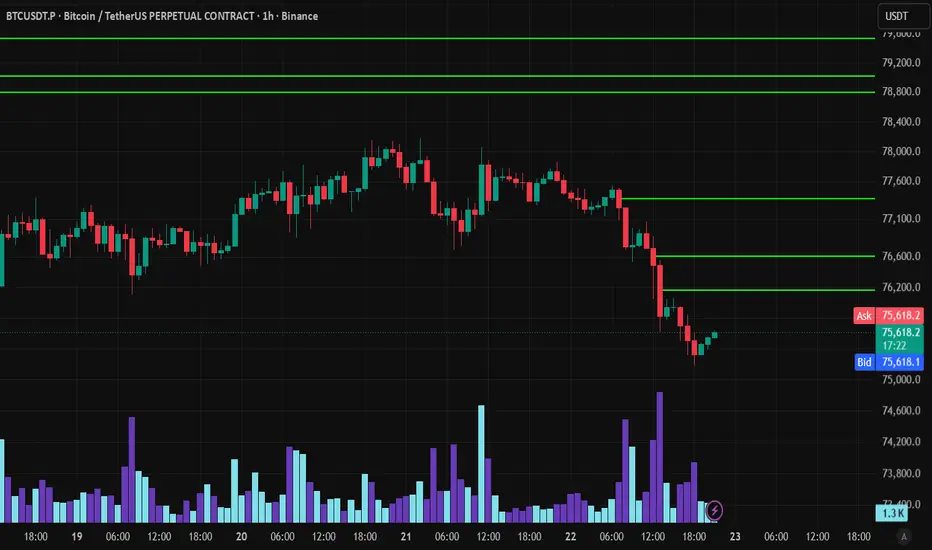
Vector Candle 50% Real Body Levels [v6]
Overview
This indicator identifies institutional volume anomalies (known as Vector Candles) and automatically plots a dynamic horizontal level at the exact 50% of their Real Body (the midpoint between open and close, completely ignoring the wicks).
In modern trading frameworks like Smart Money Concepts (SMC) or Order Blocks, the 50% threshold of a high-volume candle represents a premium point of control where heavy institutional orders were matched. This script visualizes these areas as high-probability support or resistance zones.
To keep your charts clean and noise-free, the script features a dynamic mitigation system: the moment any future candle touch or cross the line (even just with a wick), the level is considered "claimed" and immediately vanishes from your screen.
Key Features
Real Body Midpoint Calculation: Unlike standard tools that calculate the 50% level using the absolute High and Low, this indicator targets the core of the market commitment by averaging only the open and close prices.
Volume Threshold Filters: Dynamically benchmarks current volume against a Simple Moving Average (SMA) lookback period, filtering out normal market noise and highlighting only genuine capital injections.
Auto-Clean Mitigation Logic: Levels instantly self-destruct once price mitigates or tests the exact coordinate, ensuring every single line visible on your chart is 100% active and pending.
Engineered for v6 Performance: Built using Pine Script v6 User-Defined Types (UDTs) and efficient array memory management to prevent any charting lag, even during high-volatility sessions or lower timeframes.
Inputs & Customization
Average Volume Lookback: The period used to establish the baseline volume average (Default: 10).
Volume Multiplier 1 (VF) / Multiplier 2 (VA): Sensitivity thresholds to define what qualifies as an extraordinary volume vector (e.g., 2.0x or 1.5x above average).
Level Style Options: Easily adjust the horizontal line color and thickness to blend seamlessly with your personal chart layout.
How to Trade with It
Bullish Vector Mitigation (Support): When a high-volume bullish candle forms, look for the price to retrace downward to test the green horizontal line. This 50% body zone often acts as a strong bullish pivot.
Bearish Vector Mitigation (Resistance): When a high-volume bearish candle drops, look for short-term relief rallies to cap out exactly at the 50% body line, offering high R:R (Risk-to-Reward) short entries.
Breakout Tracking: If a level is pierced through aggressively rather than holding as pivot support/resistance, it indicates a structural shift in market direction.
Overview
This indicator identifies institutional volume anomalies (known as Vector Candles) and automatically plots a dynamic horizontal level at the exact 50% of their Real Body (the midpoint between open and close, completely ignoring the wicks).
In modern trading frameworks like Smart Money Concepts (SMC) or Order Blocks, the 50% threshold of a high-volume candle represents a premium point of control where heavy institutional orders were matched. This script visualizes these areas as high-probability support or resistance zones.
To keep your charts clean and noise-free, the script features a dynamic mitigation system: the moment any future candle touch or cross the line (even just with a wick), the level is considered "claimed" and immediately vanishes from your screen.
Key Features
Real Body Midpoint Calculation: Unlike standard tools that calculate the 50% level using the absolute High and Low, this indicator targets the core of the market commitment by averaging only the open and close prices.
Volume Threshold Filters: Dynamically benchmarks current volume against a Simple Moving Average (SMA) lookback period, filtering out normal market noise and highlighting only genuine capital injections.
Auto-Clean Mitigation Logic: Levels instantly self-destruct once price mitigates or tests the exact coordinate, ensuring every single line visible on your chart is 100% active and pending.
Engineered for v6 Performance: Built using Pine Script v6 User-Defined Types (UDTs) and efficient array memory management to prevent any charting lag, even during high-volatility sessions or lower timeframes.
Inputs & Customization
Average Volume Lookback: The period used to establish the baseline volume average (Default: 10).
Volume Multiplier 1 (VF) / Multiplier 2 (VA): Sensitivity thresholds to define what qualifies as an extraordinary volume vector (e.g., 2.0x or 1.5x above average).
Level Style Options: Easily adjust the horizontal line color and thickness to blend seamlessly with your personal chart layout.
How to Trade with It
Bullish Vector Mitigation (Support): When a high-volume bullish candle forms, look for the price to retrace downward to test the green horizontal line. This 50% body zone often acts as a strong bullish pivot.
Bearish Vector Mitigation (Resistance): When a high-volume bearish candle drops, look for short-term relief rallies to cap out exactly at the 50% body line, offering high R:R (Risk-to-Reward) short entries.
Breakout Tracking: If a level is pierced through aggressively rather than holding as pivot support/resistance, it indicates a structural shift in market direction.
סקריפט קוד פתוח
ברוח האמיתית של TradingView, יוצר הסקריפט הזה הפך אותו לקוד פתוח, כך שסוחרים יוכלו לעיין בו ולאמת את פעולתו. כל הכבוד למחבר! אמנם ניתן להשתמש בו בחינם, אך זכור כי פרסום חוזר של הקוד כפוף ל־כללי הבית שלנו.

כתב ויתור
המידע והפרסומים אינם מיועדים להיות, ואינם מהווים, ייעוץ או המלצה פיננסית, השקעתית, מסחרית או מכל סוג אחר המסופקת או מאושרת על ידי TradingView. קרא עוד ב־תנאי השימוש.
סקריפט קוד פתוח
ברוח האמיתית של TradingView, יוצר הסקריפט הזה הפך אותו לקוד פתוח, כך שסוחרים יוכלו לעיין בו ולאמת את פעולתו. כל הכבוד למחבר! אמנם ניתן להשתמש בו בחינם, אך זכור כי פרסום חוזר של הקוד כפוף ל־כללי הבית שלנו.
כתב ויתור
המידע והפרסומים אינם מיועדים להיות, ואינם מהווים, ייעוץ או המלצה פיננסית, השקעתית, מסחרית או מכל סוג אחר המסופקת או מאושרת על ידי TradingView. קרא עוד ב־תנאי השימוש.