Heatmap Liquidity Zones [BigBeluga]
🔵 OVERVIEW
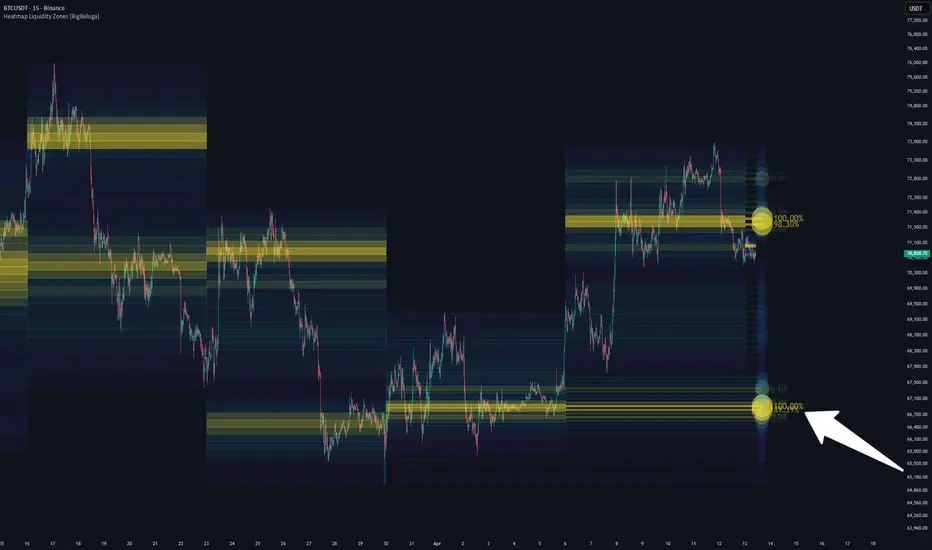
Heatmap Liquidity Zones [BigBeluga] is a higher-timeframe volume heatmap tool designed to reveal where liquidity is concentrated inside institutional ranges.
Instead of plotting a traditional volume profile, this indicator builds a dynamic heatmap across each selected higher-timeframe candle.
It highlights high-volume price clusters, filters significant liquidity zones, and extends them forward as actionable support/resistance levels.

The result is a clean liquidity map that visualizes where participation is strongest — and where reactions are most likely to occur.
🔵 CORE CONCEPT
🔵 HOW IT WORKS
1️⃣ Higher-Timeframe Reset Logic
2️⃣ ATR-Based Bin Construction
3️⃣ Volume Distribution
4️⃣ Liquidity Zone Creation

🔵 HEATMAP VISUAL STRUCTURE
🔵 OPTIONAL MOVING AVERAGE
🔵 KEY FEATURES
🔵 HOW TO USE
🔵 INTERPRETING LIQUIDITY
🔵 CONCLUSION
Heatmap Liquidity Zones [BigBeluga] transforms higher-timeframe volume into a structured liquidity map.
By combining ATR-adaptive binning, density-based heat gradients, and intelligent liquidity filtering, it highlights where institutional participation is concentrated — and where meaningful reactions are most likely.
This makes it especially powerful for identifying liquidity pools, sweep zones, and structural turning points.
Heatmap Liquidity Zones [BigBeluga] is a higher-timeframe volume heatmap tool designed to reveal where liquidity is concentrated inside institutional ranges.
Instead of plotting a traditional volume profile, this indicator builds a dynamic heatmap across each selected higher-timeframe candle.
It highlights high-volume price clusters, filters significant liquidity zones, and extends them forward as actionable support/resistance levels.
The result is a clean liquidity map that visualizes where participation is strongest — and where reactions are most likely to occur.
🔵 CORE CONCEPT
- HTF Range Segmentation — Each higher-timeframe candle (D/W/M or custom) defines a new accumulation range.
- ATR-Based Adaptive Binning — Vertical bin size is derived from ATR to maintain consistent resolution across volatility regimes.
- Volume Density Mapping — Volume is distributed into price bins and normalized relative to the highest-volume bin.
- Liquidity Filtering — Only bins exceeding a configurable percentage threshold are promoted to active liquidity levels.
- Self-Cleaning Zones — Liquidity levels automatically disappear once breached by price.
🔵 HOW IT WORKS
1️⃣ Higher-Timeframe Reset Logic
- When a new selected HTF candle begins, the previous range is finalized.
- A new accumulation range starts from that bar.
- High and Low are tracked dynamically throughout the segment.
2️⃣ ATR-Based Bin Construction
- ATR defines the vertical bin size (ATR × Multiplier).
- The total range is divided into up to Max Bins.
- This ensures bin resolution adapts automatically to volatility.
3️⃣ Volume Distribution
- For each completed segment, volume is distributed into bins based on proximity to bin midpoint.
- Volume per bin is normalized relative to the maximum bin.
- Each bin is assigned a heat color based on relative density:
- Low Density → Purple
- Mid Density → Cyan
- High Density → Yellow
4️⃣ Liquidity Zone Creation
- If a bin exceeds the Liquidity Filter %, it becomes a tracked liquidity level.
- Liquidity levels extend forward as horizontal lines.
- The thickness is controlled by Liquidity Level Width.
- Stronger zones display larger markers and percentage labels.
🔵 HEATMAP VISUAL STRUCTURE
- Completed segments display full heatmap boxes across the range.
- Active segment updates in real time.
- Color intensity reflects liquidity concentration.
- High-density zones stand out clearly for institutional reference.
🔵 OPTIONAL MOVING AVERAGE
- Optional smoothing MA overlay (SMA, EMA, RMA, WMA, VWMA).
- Hidden by default.
- Can be used for confluence with liquidity zones.
🔵 KEY FEATURES
- Higher-timeframe segmented liquidity mapping.
- ATR-based adaptive resolution.
- Three-stage heatmap gradient.
- Configurable liquidity filtering.
- Auto-expiring support/resistance levels.
- Dynamic zone thickness based on volume strength.
- Real-time developing heatmap.
- Optional MA overlay.
🔵 HOW TO USE
- Focus on yellow (high-density) zones for strongest liquidity pools.
- Watch reactions at filtered liquidity levels.
- Use HTF segmentation (Weekly/Monthly) to identify institutional positioning.
- Combine with breakout tools for liquidity sweep setups.
- Lower ATR multiplier → more granular liquidity clusters.
- Higher Liquidity Filter % → only strongest zones remain.
🔵 INTERPRETING LIQUIDITY
- High density near highs → potential distribution.
- High density near lows → potential accumulation.
- Clustered zones → compression areas before expansion.
- Thin zones → low participation, faster price movement potential.
🔵 CONCLUSION
Heatmap Liquidity Zones [BigBeluga] transforms higher-timeframe volume into a structured liquidity map.
By combining ATR-adaptive binning, density-based heat gradients, and intelligent liquidity filtering, it highlights where institutional participation is concentrated — and where meaningful reactions are most likely.
This makes it especially powerful for identifying liquidity pools, sweep zones, and structural turning points.

🌐 bigbeluga.org/tv - Get access to our powerful tools & indicators.
🔵 Learn More -> docs.bigbeluga.org/
🔵 Join Discord -> go.bigbeluga.org/k65q9bfqfu
All content provided by BigBeluga is for educational purposes only
🔵 Learn More -> docs.bigbeluga.org/
🔵 Join Discord -> go.bigbeluga.org/k65q9bfqfu
All content provided by BigBeluga is for educational purposes only
כתב ויתור
המידע והפרסומים אינם מיועדים להיות, ואינם מהווים, ייעוץ או המלצה פיננסית, השקעתית, מסחרית או מכל סוג אחר המסופקת או מאושרת על ידי TradingView. קרא עוד ב־תנאי השימוש.