OPEN-SOURCE SCRIPT
Sideways Zone Breakout
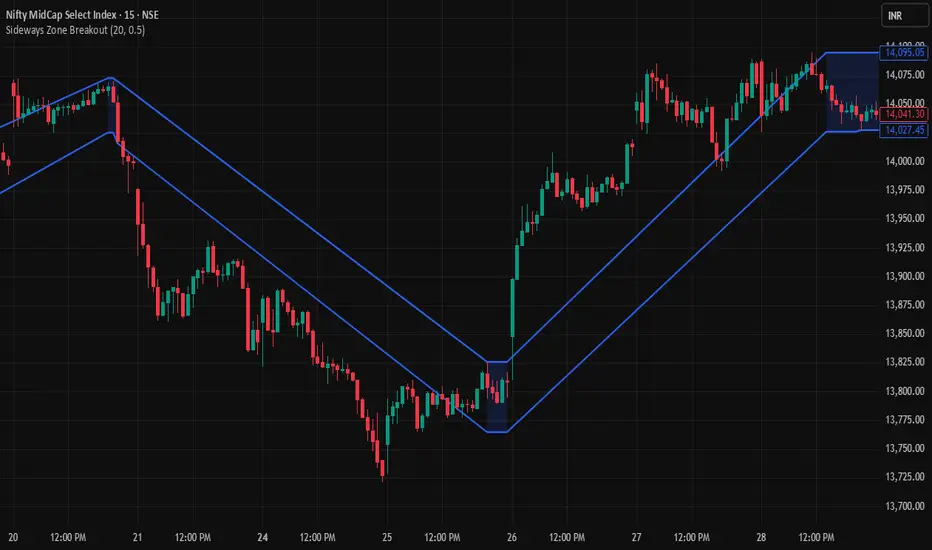
Sideways Zone Breakout is a price action–based indicator designed to identify low-volatility consolidation zones and highlight confirmed breakout opportunities. Consolidation phases often occur before strong directional moves, and this indicator helps traders visually detect those phases and act on potential breakouts.
The indicator analyzes price over a user-defined lookback period and calculates the highest high and lowest low to determine the total range. If the range remains within a user-defined percentage threshold, the market is considered to be in a sideways or consolidation state. During this phase, the indicator plots a clearly defined zone on the chart representing the consolidation range.
Once the market breaks above or below this zone and the candle closes outside the boundary, the indicator generates a breakout signal. A green upward arrow appears when price breaks above the consolidation zone, indicating a potential bullish breakout. A red downward arrow appears when price breaks below the consolidation zone, indicating a potential bearish breakout. Signals are confirmed only on candle close, which helps reduce false or premature signals.
This indicator can be used on any symbol and any timeframe, including stocks, indices, forex, and cryptocurrencies. It is useful for intraday trading, swing trading, and trend-following strategies.
Important: If no zones or signals appear on your chart, adjust the "Sideways Lookback" and "Max Range %" settings according to the symbol and timeframe. Different markets and volatility conditions require different parameter values for optimal detection.
This tool helps traders identify consolidation zones, anticipate breakout movements, and improve entry timing based on market structure and volatility contraction.
The indicator analyzes price over a user-defined lookback period and calculates the highest high and lowest low to determine the total range. If the range remains within a user-defined percentage threshold, the market is considered to be in a sideways or consolidation state. During this phase, the indicator plots a clearly defined zone on the chart representing the consolidation range.
Once the market breaks above or below this zone and the candle closes outside the boundary, the indicator generates a breakout signal. A green upward arrow appears when price breaks above the consolidation zone, indicating a potential bullish breakout. A red downward arrow appears when price breaks below the consolidation zone, indicating a potential bearish breakout. Signals are confirmed only on candle close, which helps reduce false or premature signals.
This indicator can be used on any symbol and any timeframe, including stocks, indices, forex, and cryptocurrencies. It is useful for intraday trading, swing trading, and trend-following strategies.
Important: If no zones or signals appear on your chart, adjust the "Sideways Lookback" and "Max Range %" settings according to the symbol and timeframe. Different markets and volatility conditions require different parameter values for optimal detection.
This tool helps traders identify consolidation zones, anticipate breakout movements, and improve entry timing based on market structure and volatility contraction.
סקריפט קוד פתוח
ברוח האמיתית של TradingView, יוצר הסקריפט הזה הפך אותו לקוד פתוח, כך שסוחרים יוכלו לעיין בו ולאמת את פעולתו. כל הכבוד למחבר! אמנם ניתן להשתמש בו בחינם, אך זכור כי פרסום חוזר של הקוד כפוף ל־כללי הבית שלנו.

For access & queries: algochiefsupport@gmail.com
כתב ויתור
המידע והפרסומים אינם מיועדים להיות, ואינם מהווים, ייעוץ או המלצה פיננסית, השקעתית, מסחרית או מכל סוג אחר המסופקת או מאושרת על ידי TradingView. קרא עוד ב־תנאי השימוש.
סקריפט קוד פתוח
ברוח האמיתית של TradingView, יוצר הסקריפט הזה הפך אותו לקוד פתוח, כך שסוחרים יוכלו לעיין בו ולאמת את פעולתו. כל הכבוד למחבר! אמנם ניתן להשתמש בו בחינם, אך זכור כי פרסום חוזר של הקוד כפוף ל־כללי הבית שלנו.
For access & queries: algochiefsupport@gmail.com
כתב ויתור
המידע והפרסומים אינם מיועדים להיות, ואינם מהווים, ייעוץ או המלצה פיננסית, השקעתית, מסחרית או מכל סוג אחר המסופקת או מאושרת על ידי TradingView. קרא עוד ב־תנאי השימוש.