Oscillator MTF Fan RSI STOCH
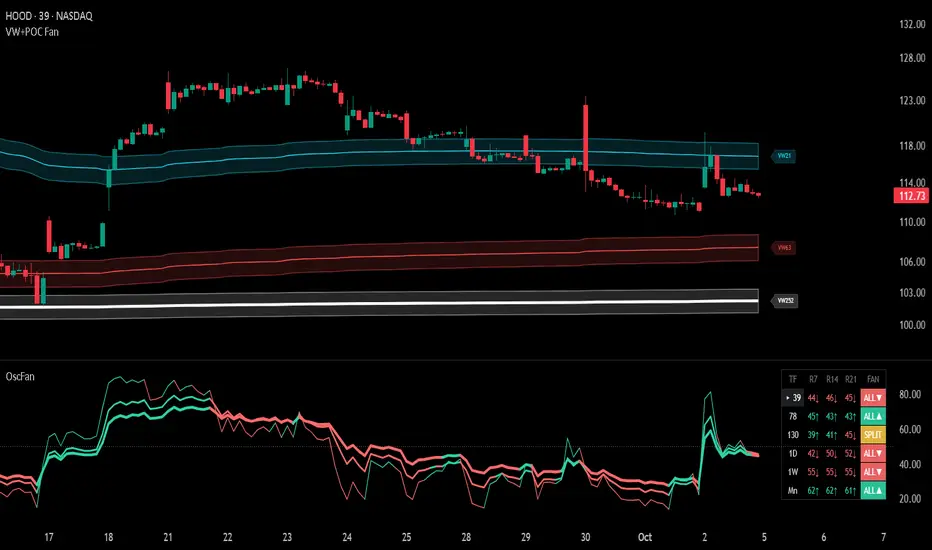
Osc Fan plots three momentum legs (fast / mid / slow) on one timeframe you choose and shows the same fan across a multi-timeframe ladder in a compact dashboard. It is built to show where the legs DISAGREE, not to stack confirmations.
ENGINES
RSI: lengths 7 / 14 / 21, each compared to ONE shared, fixed EMA(9) signal.
Stoch: lengths 9 / 21 / 34 smoothed %K, each compared to its own %D. %K and %D smoothing are shared and fixed across the three legs.
Each leg is colored by its own state: above its signal = up, below = down. It is a momentum-state fan, so a green leg is above its signal, not necessarily rising. The signal is deliberately not scaled with length. A scaled stack (for example 15/3, 30/6, 45/9) draws the same curve at three zoom levels, while a fixed signal keeps the legs structurally different. Each engine keeps its own lengths, so switching between RSI and Stoch overwrites nothing.
THE PLOTTED FAN
The "Fan timeframe" input sets which timeframe is plotted in the pane (blank = chart timeframe). If you pick a timeframe below the chart's, the fan falls back to the chart timeframe and the dashboard marks it with *.
DASHBOARD
Columns: TF | F M S | FAN | AGR. One row per ladder timeframe (10 / 39 / 78 / 130 / D / W / M, with 78 and M off by default), each calculated in that timeframe's own bars. Timeframes below the chart's are skipped. The row matching the plotted fan is marked ▸.
F M S: value plus a state arrow. Under Stoch, a marker appears when %K is past overbought or oversold. The color still reflects K vs D, because strong trends can stay overbought.
FAN: ALL▲, ALL▼, or SPLIT (not unanimous).
AGR: how often the fast and slow legs agree over a lookback, counted only on bars where both are directional. The default κ mode is Cohen's kappa, which measures agreement beyond what each leg's own up/down tendency would produce, so a long trend that keeps both legs up does not inflate it. High κ means the slow leg flips on the same bars as the fast leg and adds no timing of its own. % mode shows raw agreement.
There is intentionally no "N of 7 aligned" score. Timeframes of one calculation are not independent votes; read the rows for disagreement and for which timeframe turned first.
LEVELS
RSI variance shrinks as length grows, so a fixed 30/70 means something different on each leg; under RSI only the 50 midline is drawn. Stoch range position is the same at every length, so overbought/oversold lines are drawn under Stoch.
REPAINTING
Higher timeframes are requested with lookahead off and no offset. On the live bar, higher-timeframe rows and a higher-timeframe plotted fan show the DEVELOPING higher-timeframe bar, which can change until it closes. After a reload, history shows closed-bar values only. This is live multi-timeframe data, not a non-repainting indicator.
ALERTS
Alerts cover the plotted fan only and fire once per event.
Live: uses the developing bar. Earliest, but can fire on a state that does not survive the close.
Confirmed: uses the last closed bar. Cannot be withdrawn, and arrives on the first tick after the close.
For a single alert, set "Alert mode" (Live, Confirmed or Both) and create an alert on "Any alert() function call". Six named conditions (Up, Down, Split × Live, Confirmed) are also available for separate alerts.
This indicator describes momentum state. It does not predict price and is not a trading system on its own.
ENGINES
RSI: lengths 7 / 14 / 21, each compared to ONE shared, fixed EMA(9) signal.
Stoch: lengths 9 / 21 / 34 smoothed %K, each compared to its own %D. %K and %D smoothing are shared and fixed across the three legs.
Each leg is colored by its own state: above its signal = up, below = down. It is a momentum-state fan, so a green leg is above its signal, not necessarily rising. The signal is deliberately not scaled with length. A scaled stack (for example 15/3, 30/6, 45/9) draws the same curve at three zoom levels, while a fixed signal keeps the legs structurally different. Each engine keeps its own lengths, so switching between RSI and Stoch overwrites nothing.
THE PLOTTED FAN
The "Fan timeframe" input sets which timeframe is plotted in the pane (blank = chart timeframe). If you pick a timeframe below the chart's, the fan falls back to the chart timeframe and the dashboard marks it with *.
DASHBOARD
Columns: TF | F M S | FAN | AGR. One row per ladder timeframe (10 / 39 / 78 / 130 / D / W / M, with 78 and M off by default), each calculated in that timeframe's own bars. Timeframes below the chart's are skipped. The row matching the plotted fan is marked ▸.
F M S: value plus a state arrow. Under Stoch, a marker appears when %K is past overbought or oversold. The color still reflects K vs D, because strong trends can stay overbought.
FAN: ALL▲, ALL▼, or SPLIT (not unanimous).
AGR: how often the fast and slow legs agree over a lookback, counted only on bars where both are directional. The default κ mode is Cohen's kappa, which measures agreement beyond what each leg's own up/down tendency would produce, so a long trend that keeps both legs up does not inflate it. High κ means the slow leg flips on the same bars as the fast leg and adds no timing of its own. % mode shows raw agreement.
There is intentionally no "N of 7 aligned" score. Timeframes of one calculation are not independent votes; read the rows for disagreement and for which timeframe turned first.
LEVELS
RSI variance shrinks as length grows, so a fixed 30/70 means something different on each leg; under RSI only the 50 midline is drawn. Stoch range position is the same at every length, so overbought/oversold lines are drawn under Stoch.
REPAINTING
Higher timeframes are requested with lookahead off and no offset. On the live bar, higher-timeframe rows and a higher-timeframe plotted fan show the DEVELOPING higher-timeframe bar, which can change until it closes. After a reload, history shows closed-bar values only. This is live multi-timeframe data, not a non-repainting indicator.
ALERTS
Alerts cover the plotted fan only and fire once per event.
Live: uses the developing bar. Earliest, but can fire on a state that does not survive the close.
Confirmed: uses the last closed bar. Cannot be withdrawn, and arrives on the first tick after the close.
For a single alert, set "Alert mode" (Live, Confirmed or Both) and create an alert on "Any alert() function call". Six named conditions (Up, Down, Split × Live, Confirmed) are also available for separate alerts.
This indicator describes momentum state. It does not predict price and is not a trading system on its own.

כתב ויתור
המידע והפרסומים אינם מיועדים להיות, ואינם מהווים, ייעוץ או המלצה פיננסית, השקעתית, מסחרית או מכל סוג אחר המסופקת או מאושרת על ידי TradingView. קרא עוד ב־תנאי השימוש.
כתב ויתור
המידע והפרסומים אינם מיועדים להיות, ואינם מהווים, ייעוץ או המלצה פיננסית, השקעתית, מסחרית או מכל סוג אחר המסופקת או מאושרת על ידי TradingView. קרא עוד ב־תנאי השימוש.