OPEN-SOURCE SCRIPT
FagoriTools 1.0
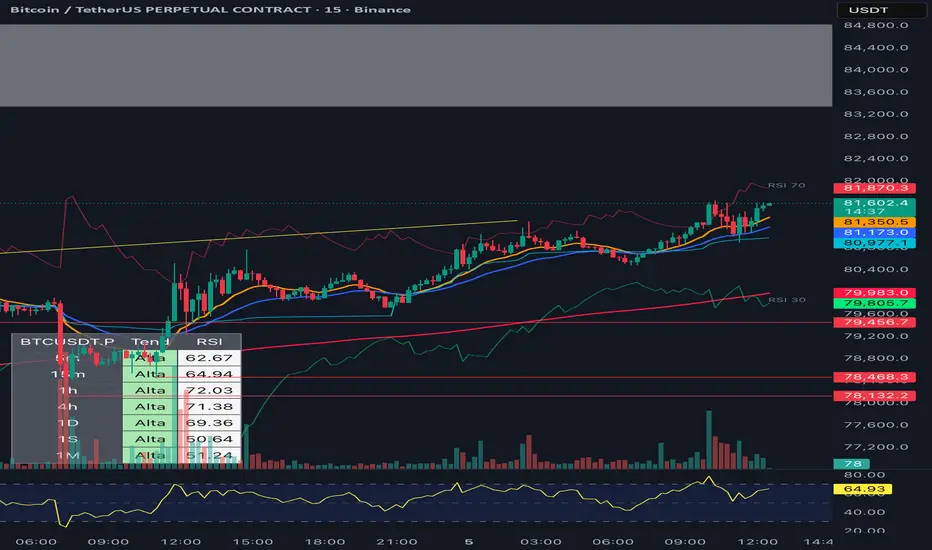
**FagoriTools — Multi-TF Trend + Reverse RSI Levels**
All-in-one indicator that combines three utilities into a single script to reduce visual clutter on the chart:
**1) Configurable EMAs**
Five independent exponential moving averages, each with its own period, color, and on/off toggle. Default values follow common combinations: 9, 12, 26, 50, and 200. Useful for those who rely on classic crossovers (12/26, 50/200) and want all references consolidated within one indicator.
**2) Reverse RSI Levels**
Instead of displaying the RSI in a separate panel, this module plots two lines directly over price, indicating the exact value at which the asset would need to close for the RSI to reach the oversold (default 30) and overbought (default 70) thresholds.
The calculation inverts the RSI formula: starting from the current gain and loss averages (RMA), it solves the equation for the `close` value that would produce the target RSI, accounting for Wilder's smoothing. This allows you to see at a glance, "if it drops to X, it becomes oversold" or "to turn overbought, it needs to rise to Y," without switching between panels.
Both the RSI levels and the period (default 14) are fully customizable.
**3) Multi-Timeframe Table**
A consolidated panel displaying the asset's reading across seven timeframes: 5m, 15m, 1h, 4h, 1D, 1W, and 1M (each can be toggled on or off individually).
For each timeframe, the table shows:
* Trend — trend direction (Up/Down) based on the close relative to the slow EMA. Green = Up, Red = Down.
* RSI — numeric RSI value for that timeframe, with the background color reflecting the trend.
* Fixed (optional) — the same trend reading applied to a fixed pair chosen by the user (e.g., SPX500, DXY, BTCUSDT). Useful for tracking correlation with a benchmark without switching charts.
The table position is configurable across two dimensions (vertical: Top/Middle/Bottom; horizontal: Left/Right).
**How to Use**
1. Enable the EMAs that align with your strategy.
2. Adjust the RSI levels according to your style (some prefer 20/80 in crypto, 30/70 in stocks).
3. Use the multi-TF table to align your trades with the higher timeframe trend. Entries against the trend of larger timeframes typically have a lower win rate.
**Notes**
* The Reverse RSI is a deterministic calculation, not a projection. The value displayed is the current price required for the RSI to reach the target, and it updates with every candle.
* The "Fixed" column depends on the chosen symbol being available on the broker. Otherwise, it remains blank.
* Indicator is overlaid on price, working with any asset and timeframe.
All-in-one indicator that combines three utilities into a single script to reduce visual clutter on the chart:
**1) Configurable EMAs**
Five independent exponential moving averages, each with its own period, color, and on/off toggle. Default values follow common combinations: 9, 12, 26, 50, and 200. Useful for those who rely on classic crossovers (12/26, 50/200) and want all references consolidated within one indicator.
**2) Reverse RSI Levels**
Instead of displaying the RSI in a separate panel, this module plots two lines directly over price, indicating the exact value at which the asset would need to close for the RSI to reach the oversold (default 30) and overbought (default 70) thresholds.
The calculation inverts the RSI formula: starting from the current gain and loss averages (RMA), it solves the equation for the `close` value that would produce the target RSI, accounting for Wilder's smoothing. This allows you to see at a glance, "if it drops to X, it becomes oversold" or "to turn overbought, it needs to rise to Y," without switching between panels.
Both the RSI levels and the period (default 14) are fully customizable.
**3) Multi-Timeframe Table**
A consolidated panel displaying the asset's reading across seven timeframes: 5m, 15m, 1h, 4h, 1D, 1W, and 1M (each can be toggled on or off individually).
For each timeframe, the table shows:
* Trend — trend direction (Up/Down) based on the close relative to the slow EMA. Green = Up, Red = Down.
* RSI — numeric RSI value for that timeframe, with the background color reflecting the trend.
* Fixed (optional) — the same trend reading applied to a fixed pair chosen by the user (e.g., SPX500, DXY, BTCUSDT). Useful for tracking correlation with a benchmark without switching charts.
The table position is configurable across two dimensions (vertical: Top/Middle/Bottom; horizontal: Left/Right).
**How to Use**
1. Enable the EMAs that align with your strategy.
2. Adjust the RSI levels according to your style (some prefer 20/80 in crypto, 30/70 in stocks).
3. Use the multi-TF table to align your trades with the higher timeframe trend. Entries against the trend of larger timeframes typically have a lower win rate.
**Notes**
* The Reverse RSI is a deterministic calculation, not a projection. The value displayed is the current price required for the RSI to reach the target, and it updates with every candle.
* The "Fixed" column depends on the chosen symbol being available on the broker. Otherwise, it remains blank.
* Indicator is overlaid on price, working with any asset and timeframe.
סקריפט קוד פתוח
ברוח האמיתית של TradingView, יוצר הסקריפט הזה הפך אותו לקוד פתוח, כך שסוחרים יוכלו לעיין בו ולאמת את פעולתו. כל הכבוד למחבר! אמנם ניתן להשתמש בו בחינם, אך זכור כי פרסום חוזר של הקוד כפוף ל־כללי הבית שלנו.

כתב ויתור
המידע והפרסומים אינם מיועדים להיות, ואינם מהווים, ייעוץ או המלצה פיננסית, השקעתית, מסחרית או מכל סוג אחר המסופקת או מאושרת על ידי TradingView. קרא עוד ב־תנאי השימוש.
סקריפט קוד פתוח
ברוח האמיתית של TradingView, יוצר הסקריפט הזה הפך אותו לקוד פתוח, כך שסוחרים יוכלו לעיין בו ולאמת את פעולתו. כל הכבוד למחבר! אמנם ניתן להשתמש בו בחינם, אך זכור כי פרסום חוזר של הקוד כפוף ל־כללי הבית שלנו.
כתב ויתור
המידע והפרסומים אינם מיועדים להיות, ואינם מהווים, ייעוץ או המלצה פיננסית, השקעתית, מסחרית או מכל סוג אחר המסופקת או מאושרת על ידי TradingView. קרא עוד ב־תנאי השימוש.