CIT ZigZag Projection
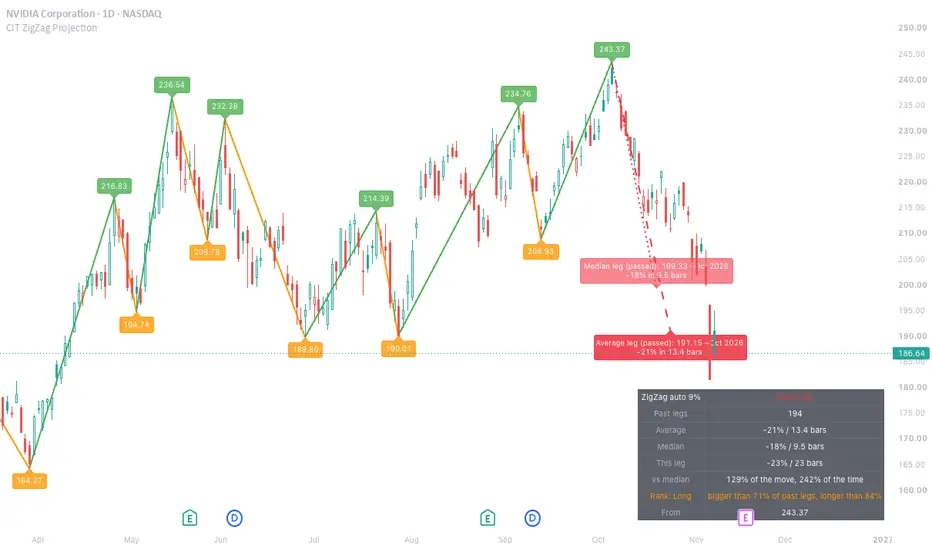
CIT ZigZag Projection measures every past zigzag swing and projects the swing in progress by the average and median size and length of the past swings in the same direction.
HOW IT WORKS
A zigzag on highs and lows turns when price reverses by the deviation % from its latest extreme. Each completed up-leg (low to high) and down-leg (high to low) is recorded with its % move and its length in bars.
When the last confirmed turn is a low, the zigzag points up and the up-leg in progress is projected from that low:
- average: the low x (1 + the average % gain of all past up-legs), reached after their average number of bars
- median: the same with the medians, which are less affected by a few extreme swings
When the last turn is a high, the down-leg in progress is projected the same way with the past down-legs. Each projection is a dashed (average) or dotted (median) line from the last turn to the target, with a label showing the price and the date it would be reached. Once price has gone past a target the label says "(passed)".
STATISTICS TABLE
- the deviation in use and the leg direction
- the number of past legs counted
- the average and median % move and length in bars
- this leg so far: % move and bars
- this leg against the median: what share of the usual move and of the usual time it has covered
- rank: the share of past legs this one has already outgrown, in size (to its extreme so far) and in time, with a tier: Early (under 50%), Typical, Long (80% or more) or Extreme (95% or more)
- the price the leg started from
WHAT'S DIFFERENT
Other zigzag tools label each swing or average swings in points. This one:
- measures swings in % rather than price, so legs from different price levels and decades compare fairly
- shows the average and the median side by side, each with a target date as well as a price
- tells how far the current leg has come against the median move and time, and ranks it against all past legs (Early, Typical, Long, Extreme)
- can count only the legs since a chosen year, to keep old, different markets out of the statistics
- can set the reversal deviation automatically from the symbol's volatility (an ATR %), so one setting works from daily stocks to quarterly index charts
SETTINGS
- Reversal deviation (%): how far price must reverse to confirm a turn. Rough guide: 30-35% on quarterly index charts, 5-10% on daily stocks.
- Automatic reversal deviation: instead of a fixed %, use a multiple (default 3) of the average true range as a % of price over the last bars (default 50). It adapts to each symbol and time frame, for example about 30-35% on the quarterly Dow, 3-4% on daily index ETFs and 6-12% on daily stocks. The table shows the % in use.
- Count legs since (year): use only the legs that start in or after this year, for example the modern legs of a long index history.
- Fewest past legs to project, the zigzag and projection colors (up legs green, down legs orange), the table on or off and its position.
HOW TO READ IT
The projections answer one question: if this swing turns out to be an ordinary one for this market, where and when would it end? A leg that has already covered more than the median move and time is stretched by the market's own history; one that has covered little has room left if it is typical. Few legs (on short histories or large deviations) make the averages rough.
The projections are averages of past swings, not forecasts, and the last zigzag turn can still change until price reverses by the deviation. For education only, not investment advice.
HOW IT WORKS
A zigzag on highs and lows turns when price reverses by the deviation % from its latest extreme. Each completed up-leg (low to high) and down-leg (high to low) is recorded with its % move and its length in bars.
When the last confirmed turn is a low, the zigzag points up and the up-leg in progress is projected from that low:
- average: the low x (1 + the average % gain of all past up-legs), reached after their average number of bars
- median: the same with the medians, which are less affected by a few extreme swings
When the last turn is a high, the down-leg in progress is projected the same way with the past down-legs. Each projection is a dashed (average) or dotted (median) line from the last turn to the target, with a label showing the price and the date it would be reached. Once price has gone past a target the label says "(passed)".
STATISTICS TABLE
- the deviation in use and the leg direction
- the number of past legs counted
- the average and median % move and length in bars
- this leg so far: % move and bars
- this leg against the median: what share of the usual move and of the usual time it has covered
- rank: the share of past legs this one has already outgrown, in size (to its extreme so far) and in time, with a tier: Early (under 50%), Typical, Long (80% or more) or Extreme (95% or more)
- the price the leg started from
WHAT'S DIFFERENT
Other zigzag tools label each swing or average swings in points. This one:
- measures swings in % rather than price, so legs from different price levels and decades compare fairly
- shows the average and the median side by side, each with a target date as well as a price
- tells how far the current leg has come against the median move and time, and ranks it against all past legs (Early, Typical, Long, Extreme)
- can count only the legs since a chosen year, to keep old, different markets out of the statistics
- can set the reversal deviation automatically from the symbol's volatility (an ATR %), so one setting works from daily stocks to quarterly index charts
SETTINGS
- Reversal deviation (%): how far price must reverse to confirm a turn. Rough guide: 30-35% on quarterly index charts, 5-10% on daily stocks.
- Automatic reversal deviation: instead of a fixed %, use a multiple (default 3) of the average true range as a % of price over the last bars (default 50). It adapts to each symbol and time frame, for example about 30-35% on the quarterly Dow, 3-4% on daily index ETFs and 6-12% on daily stocks. The table shows the % in use.
- Count legs since (year): use only the legs that start in or after this year, for example the modern legs of a long index history.
- Fewest past legs to project, the zigzag and projection colors (up legs green, down legs orange), the table on or off and its position.
HOW TO READ IT
The projections answer one question: if this swing turns out to be an ordinary one for this market, where and when would it end? A leg that has already covered more than the median move and time is stretched by the market's own history; one that has covered little has room left if it is typical. Few legs (on short histories or large deviations) make the averages rough.
The projections are averages of past swings, not forecasts, and the last zigzag turn can still change until price reverses by the deviation. For education only, not investment advice.

Trading, TA and programming are my passion
כתב ויתור
המידע והפרסומים אינם מיועדים להיות, ואינם מהווים, ייעוץ או המלצה פיננסית, השקעתית, מסחרית או מכל סוג אחר המסופקת או מאושרת על ידי TradingView. קרא עוד ב־תנאי השימוש.
Trading, TA and programming are my passion
כתב ויתור
המידע והפרסומים אינם מיועדים להיות, ואינם מהווים, ייעוץ או המלצה פיננסית, השקעתית, מסחרית או מכל סוג אחר המסופקת או מאושרת על ידי TradingView. קרא עוד ב־תנאי השימוש.