OPEN-SOURCE SCRIPT
Honeymoonist - Panic Buy / Sell
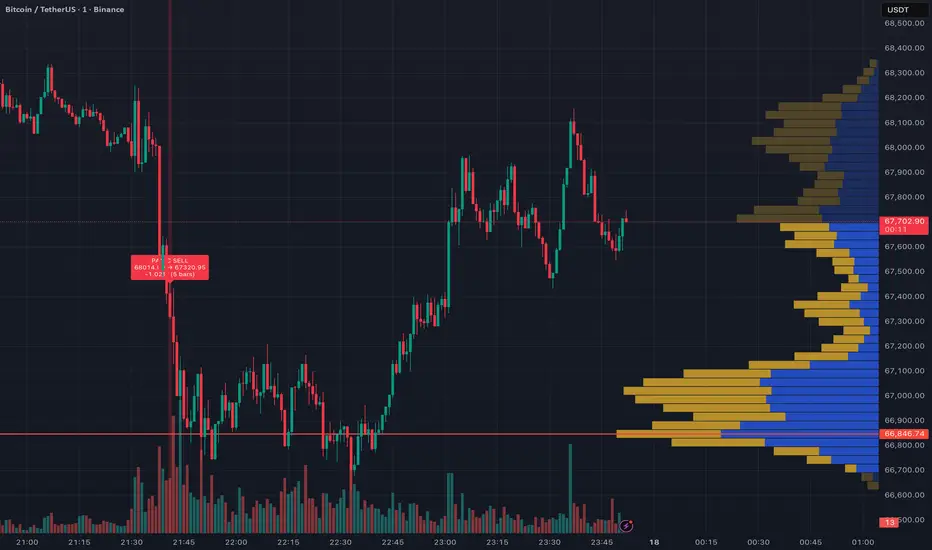
Panic Buy / Sell Detector v1 — Spot extreme price moves the moment they happen.
This overlay indicator detects sudden, abnormal price surges (Panic Buy) and sharp drops (Panic Sell) based on percentage thresholds you define. It's built for traders who want to catch moments of extreme buying or selling pressure — whether you're scalping on 1-minute charts or swing trading on daily.
━━━━━━━━━━━━━━━━━━━━━━━━━━━━━━
🔑 KEY FEATURES
• Three lookback modes to fit your trading style
• One signal per event — no duplicate or stacking labels
• Independent buy/sell cooldowns to reduce noise
• Configurable alert messages with full context (ticker, price, % change, mode)
• Clean visual output: shape markers, info labels, and background highlights
━━━━━━━━━━━━━━━━━━━━━━━━━━━━━━
📐 HOW IT WORKS
The indicator calculates the percentage change between the current close and a reference price. When this change exceeds your configured threshold, a signal fires.
% Change = (Current Close − Reference Price) / Reference Price × 100
The reference price depends on which lookback mode you choose:
1 — Bar Count
Compares close to close[N], where N is a number of bars you set (default: 10). Simple and predictable.
2 — Time Interval
Same logic as Bar Count, but N is automatically calculated from a timeframe you select. For example, if your chart is 1-minute and you choose a 5-minute lookback, N = 5 bars. This keeps the lookback consistent even if you switch chart timeframes.
N = ceil(Lookback Timeframe ÷ Chart Timeframe)
3 — Cumulative Streak
Tracks consecutive bars closing in the same direction and accumulates the total percentage change. A signal fires when the cumulative move crosses the threshold. This mode catches gradual momentum buildups that the other modes might miss.
• Neutral bars (close = previous close) keep the streak alive.
• Once a signal fires, it won't fire again until the streak ends and a new one begins.
• The first streak on chart load is suppressed to avoid false signals.
━━━━━━━━━━━━━━━━━━━━━━━━━━━━━━
⚙️ SETTINGS
Signal
• Panic Buy Threshold (%) — Minimum rise to trigger a buy signal (default: 1.0%)
• Panic Sell Threshold (%) — Minimum drop to trigger a sell signal (default: 1.0%)
• Lookback Mode — Bar Count, Time Interval, or Cumulative Streak
• Lookback (bars) — Number of bars for Bar Count mode (default: 10)
• Lookback Timeframe — Timeframe for Time Interval mode (default: 1 min)
• Cooldown (bars) — Minimum bars between same-type signals (default: 3)
Alert
• Alert Only on Bar Close — When on, alerts wait for bar confirmation. When off (default), alerts fire on the first tick that crosses the threshold. Faster, but may produce false signals if the bar reverses.
Visuals
• Show Info Labels — Toggle the detail labels on/off
• Show Background — Toggle background highlighting on/off
• Label Size — tiny / small / normal / large
• Panic Buy Color / Panic Sell Color — Customise signal colours
• Background Opacity — 0 (fully opaque) to 100 (fully transparent)
━━━━━━━━━━━━━━━━━━━━━━━━━━━━━━
🔔 ALERT SETUP
1. Add the indicator to your chart
2. Create a new alert → Condition: "Panic Buy / Sell Detector"
3. Trigger: "Any alert() function call"
4. In the Message box, type: {{message}}
5. The alert will include: signal type, ticker, reference price → close price, % change, timeframe, and mode
Example alert message:
🟢 PANIC BUY — BTCUSDT.P | 98000.00 → 99200.00 | 1.22% | TF: 5 | Mode: Time Interval
🔴 PANIC SELL — BTCUSDT.P | 99200.00 → 97800.00 | -1.41% | TF: 5 | Mode: Time Interval
For webhook/bot integration (LINE, Telegram, Discord), you can use:
{"text": "{{message}}", "price": "{{close}}", "time": "{{timenow}}"}
━━━━━━━━━━━━━━━━━━━━━━━━━━━━━━
💡 TIPS
• Start with Time Interval mode — it adapts automatically when you switch chart timeframes.
• Use Cumulative Streak mode for catching slow, grinding moves that build up over many bars.
• Set cooldown to 3–5 bars to avoid alert fatigue during volatile sessions.
• Enable "Alert Only on Bar Close" for more reliable signals in backtesting or if you're away from the screen.
• Lower the threshold for stable assets (stocks, forex); raise it for volatile assets (crypto, small caps).
━━━━━━━━━━━━━━━━━━━━━━━━━━━━━━
⚠️ DISCLAIMER
This indicator is an informational tool only. It does not generate trade orders, calculate P&L, or provide financial advice. Use it as one input among many in your trading decisions. Past signals do not guarantee future results. Always manage your risk.
━━━━━━━━━━━━━━━━━━━━━━━━━━━━━━
📜 LICENSE
This source code is released under the Mozilla Public License 2.0.
This overlay indicator detects sudden, abnormal price surges (Panic Buy) and sharp drops (Panic Sell) based on percentage thresholds you define. It's built for traders who want to catch moments of extreme buying or selling pressure — whether you're scalping on 1-minute charts or swing trading on daily.
━━━━━━━━━━━━━━━━━━━━━━━━━━━━━━
🔑 KEY FEATURES
• Three lookback modes to fit your trading style
• One signal per event — no duplicate or stacking labels
• Independent buy/sell cooldowns to reduce noise
• Configurable alert messages with full context (ticker, price, % change, mode)
• Clean visual output: shape markers, info labels, and background highlights
━━━━━━━━━━━━━━━━━━━━━━━━━━━━━━
📐 HOW IT WORKS
The indicator calculates the percentage change between the current close and a reference price. When this change exceeds your configured threshold, a signal fires.
% Change = (Current Close − Reference Price) / Reference Price × 100
The reference price depends on which lookback mode you choose:
1 — Bar Count
Compares close to close[N], where N is a number of bars you set (default: 10). Simple and predictable.
2 — Time Interval
Same logic as Bar Count, but N is automatically calculated from a timeframe you select. For example, if your chart is 1-minute and you choose a 5-minute lookback, N = 5 bars. This keeps the lookback consistent even if you switch chart timeframes.
N = ceil(Lookback Timeframe ÷ Chart Timeframe)
3 — Cumulative Streak
Tracks consecutive bars closing in the same direction and accumulates the total percentage change. A signal fires when the cumulative move crosses the threshold. This mode catches gradual momentum buildups that the other modes might miss.
• Neutral bars (close = previous close) keep the streak alive.
• Once a signal fires, it won't fire again until the streak ends and a new one begins.
• The first streak on chart load is suppressed to avoid false signals.
━━━━━━━━━━━━━━━━━━━━━━━━━━━━━━
⚙️ SETTINGS
Signal
• Panic Buy Threshold (%) — Minimum rise to trigger a buy signal (default: 1.0%)
• Panic Sell Threshold (%) — Minimum drop to trigger a sell signal (default: 1.0%)
• Lookback Mode — Bar Count, Time Interval, or Cumulative Streak
• Lookback (bars) — Number of bars for Bar Count mode (default: 10)
• Lookback Timeframe — Timeframe for Time Interval mode (default: 1 min)
• Cooldown (bars) — Minimum bars between same-type signals (default: 3)
Alert
• Alert Only on Bar Close — When on, alerts wait for bar confirmation. When off (default), alerts fire on the first tick that crosses the threshold. Faster, but may produce false signals if the bar reverses.
Visuals
• Show Info Labels — Toggle the detail labels on/off
• Show Background — Toggle background highlighting on/off
• Label Size — tiny / small / normal / large
• Panic Buy Color / Panic Sell Color — Customise signal colours
• Background Opacity — 0 (fully opaque) to 100 (fully transparent)
━━━━━━━━━━━━━━━━━━━━━━━━━━━━━━
🔔 ALERT SETUP
1. Add the indicator to your chart
2. Create a new alert → Condition: "Panic Buy / Sell Detector"
3. Trigger: "Any alert() function call"
4. In the Message box, type: {{message}}
5. The alert will include: signal type, ticker, reference price → close price, % change, timeframe, and mode
Example alert message:
🟢 PANIC BUY — BTCUSDT.P | 98000.00 → 99200.00 | 1.22% | TF: 5 | Mode: Time Interval
🔴 PANIC SELL — BTCUSDT.P | 99200.00 → 97800.00 | -1.41% | TF: 5 | Mode: Time Interval
For webhook/bot integration (LINE, Telegram, Discord), you can use:
{"text": "{{message}}", "price": "{{close}}", "time": "{{timenow}}"}
━━━━━━━━━━━━━━━━━━━━━━━━━━━━━━
💡 TIPS
• Start with Time Interval mode — it adapts automatically when you switch chart timeframes.
• Use Cumulative Streak mode for catching slow, grinding moves that build up over many bars.
• Set cooldown to 3–5 bars to avoid alert fatigue during volatile sessions.
• Enable "Alert Only on Bar Close" for more reliable signals in backtesting or if you're away from the screen.
• Lower the threshold for stable assets (stocks, forex); raise it for volatile assets (crypto, small caps).
━━━━━━━━━━━━━━━━━━━━━━━━━━━━━━
⚠️ DISCLAIMER
This indicator is an informational tool only. It does not generate trade orders, calculate P&L, or provide financial advice. Use it as one input among many in your trading decisions. Past signals do not guarantee future results. Always manage your risk.
━━━━━━━━━━━━━━━━━━━━━━━━━━━━━━
📜 LICENSE
This source code is released under the Mozilla Public License 2.0.
סקריפט קוד פתוח
ברוח האמיתית של TradingView, יוצר הסקריפט הזה הפך אותו לקוד פתוח, כך שסוחרים יוכלו לעיין בו ולאמת את פעולתו. כל הכבוד למחבר! אמנם ניתן להשתמש בו בחינם, אך זכור כי פרסום חוזר של הקוד כפוף ל־כללי הבית שלנו.

כתב ויתור
המידע והפרסומים אינם מיועדים להיות, ואינם מהווים, ייעוץ או המלצה פיננסית, השקעתית, מסחרית או מכל סוג אחר המסופקת או מאושרת על ידי TradingView. קרא עוד ב־תנאי השימוש.
סקריפט קוד פתוח
ברוח האמיתית של TradingView, יוצר הסקריפט הזה הפך אותו לקוד פתוח, כך שסוחרים יוכלו לעיין בו ולאמת את פעולתו. כל הכבוד למחבר! אמנם ניתן להשתמש בו בחינם, אך זכור כי פרסום חוזר של הקוד כפוף ל־כללי הבית שלנו.
כתב ויתור
המידע והפרסומים אינם מיועדים להיות, ואינם מהווים, ייעוץ או המלצה פיננסית, השקעתית, מסחרית או מכל סוג אחר המסופקת או מאושרת על ידי TradingView. קרא עוד ב־תנאי השימוש.