OPEN-SOURCE SCRIPT
מעודכן EW Auto-Custom Elliott Wave Indicator with Fibonacci
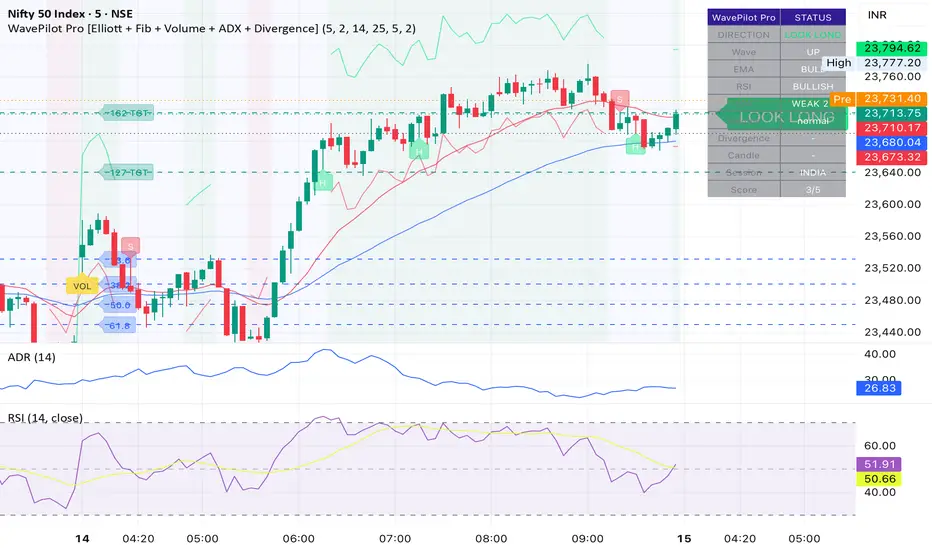
EW Auto — Custom Elliott Wave
Indicator with Fibonacci + EMA
WHAT IT DOES:
This indicator automatically detects
Elliott Wave structures (1-2-3-4-5)
on any chart using pivot high and low
detection. It combines three core
concepts into one unified tool:
1. ELLIOTT WAVE AUTO-DETECTION
Uses pivot highs and lows to
automatically identify and label
the 5-wave impulse structure in
both bullish and bearish directions.
Wave labels appear directly on
swing points so you can instantly
see where price is in the cycle.
2. FIBONACCI LEVELS
Automatically draws retracement
levels (23.6%, 38.2%, 50%, 61.8%,
78.6%) from the detected wave
structure. Extension targets at
127.2% and 161.8% are drawn as
potential wave 5 price targets.
3. EMA TREND FILTER
EMA 20 and EMA 50 are plotted
to confirm wave direction. When
price is above both EMAs with
EMA20 above EMA50 the trend is
bullish. When below both the
trend is bearish.
4. CANDLE PATTERN DETECTION
Hammer and Shooting Star candles
are automatically detected and
labeled H and S on the chart.
Hammers appear at wave bottoms
as buy confirmation. Stars appear
at wave tops as sell confirmation.
5. INFO TABLE
A dashboard in the top right corner
shows current wave direction, EMA
trend status, EMA values and latest
candle pattern in real time.
HOW TO USE:
- Increase Pivot Length for
smoother waves on higher
timeframes (8-10 on daily)
- Decrease for more signals
on intraday charts (3-5)
- Buy when Wave label shows
early wave 1 or wave 3 with
EMA aligned bullish
- Sell or short when wave 5
completes with S signal and
EMA turns bearish
- Use 38.2% and 50% fib levels
as wave 4 buy zones
- Use 127% and 162% extensions
as wave 5 profit targets
SETTINGS:
- Pivot Length: sensitivity control
- Toggle Fibonacci on or off
- Toggle wave labels on or off
- Toggle wave lines on or off
- Toggle hammer detection on or off
- Toggle info table on or off
- Customise all colors
Works on all timeframes and
all markets including stocks,
indices, forex and crypto.
NOTE: Elliott Wave analysis is
subjective. This tool is for
educational purposes. Always
use proper risk management.
Coded in Pine Script v6.
Indicator with Fibonacci + EMA
WHAT IT DOES:
This indicator automatically detects
Elliott Wave structures (1-2-3-4-5)
on any chart using pivot high and low
detection. It combines three core
concepts into one unified tool:
1. ELLIOTT WAVE AUTO-DETECTION
Uses pivot highs and lows to
automatically identify and label
the 5-wave impulse structure in
both bullish and bearish directions.
Wave labels appear directly on
swing points so you can instantly
see where price is in the cycle.
2. FIBONACCI LEVELS
Automatically draws retracement
levels (23.6%, 38.2%, 50%, 61.8%,
78.6%) from the detected wave
structure. Extension targets at
127.2% and 161.8% are drawn as
potential wave 5 price targets.
3. EMA TREND FILTER
EMA 20 and EMA 50 are plotted
to confirm wave direction. When
price is above both EMAs with
EMA20 above EMA50 the trend is
bullish. When below both the
trend is bearish.
4. CANDLE PATTERN DETECTION
Hammer and Shooting Star candles
are automatically detected and
labeled H and S on the chart.
Hammers appear at wave bottoms
as buy confirmation. Stars appear
at wave tops as sell confirmation.
5. INFO TABLE
A dashboard in the top right corner
shows current wave direction, EMA
trend status, EMA values and latest
candle pattern in real time.
HOW TO USE:
- Increase Pivot Length for
smoother waves on higher
timeframes (8-10 on daily)
- Decrease for more signals
on intraday charts (3-5)
- Buy when Wave label shows
early wave 1 or wave 3 with
EMA aligned bullish
- Sell or short when wave 5
completes with S signal and
EMA turns bearish
- Use 38.2% and 50% fib levels
as wave 4 buy zones
- Use 127% and 162% extensions
as wave 5 profit targets
SETTINGS:
- Pivot Length: sensitivity control
- Toggle Fibonacci on or off
- Toggle wave labels on or off
- Toggle wave lines on or off
- Toggle hammer detection on or off
- Toggle info table on or off
- Customise all colors
Works on all timeframes and
all markets including stocks,
indices, forex and crypto.
NOTE: Elliott Wave analysis is
subjective. This tool is for
educational purposes. Always
use proper risk management.
Coded in Pine Script v6.
הערות שחרור
NEW IN THIS VERSION:DIRECTION SIGNAL (NEW)
The most requested feature!
A large label now appears
directly on the chart showing:
LOOK LONG (green)
When Wave is UP + EMA is BULL
+ RSI is above 50
All 3 must agree for signal
LOOK SHORT (red)
When Wave is DOWN + EMA is BEAR
+ RSI is below 50
All 3 must agree for signal
STAY OUT (orange)
When signals are mixed
or conflicting
Best to wait for clarity
RSI ADDED TO TABLE (NEW)
RSI 14 now shows in dashboard
Readings:
- OVERBOUGHT (above 70)
- OVERSOLD (below 30)
- BULLISH (50 to 70)
- BEARISH (30 to 50)
BACKGROUND COLOR (NEW)
Green tint = bullish conditions
Red tint = bearish conditions
No color = mixed/wait
SCORE SYSTEM
Indicator uses a 3-point score
Wave direction = 1 point
EMA alignment = 1 point
RSI above 50 = 1 point
Score 2 or 3 = signal confirmed
Score 1 or 0 = stay out
הערות שחרור
WavePilot ProElliott Wave + Fibonacci + Volume
+ ADX + Divergence + Sessions
+ Risk Reward + Alerts
WHAT IT DOES:
All-in-one trading tool combining
Elliott Wave auto-detection with
multiple confirmation filters to
give clear LOOK LONG / LOOK SHORT
/ STAY OUT signals.
FEATURES:
1. ELLIOTT WAVE AUTO-DETECTION
Automatically labels 1-2-3-4-5
impulse waves in both bullish
and bearish directions using
pivot high and low detection.
2. FIBONACCI AUTO-LEVELS
Draws retracements 23.6% to 78.6%
plus extension targets 127% and
162% automatically from wave
structure.
3. DIRECTION SIGNAL
Large label on chart shows:
LOOK LONG - green - when Wave UP
+ EMA BULL + RSI above 50
+ ADX strong + volume confirms
LOOK SHORT - red - opposite
STAY OUT - orange - mixed signals
Needs 3 out of 5 to confirm.
4. VOLUME CONFIRMATION
VOL label appears when volume
spikes above 2x average.
Breakouts with high volume are
more reliable than low volume.
Multiplier adjustable in settings.
5. ADX TREND STRENGTH
Shows if trend is STRONG or WEAK.
Only trade when ADX above 25.
Weak ADX means choppy market
avoid trading in those conditions.
6. RSI DIVERGENCE DETECTION
BULL DIV label when price makes
lower low but RSI makes higher low.
BEAR DIV label when price makes
higher high but RSI makes lower high.
Early warning of reversals.
7. RISK REWARD LINES
Auto stop loss line below/above
current price based on ATR.
Auto take profit line at your
chosen RR ratio (default 2.0).
Only appears on strong signals.
8. MARKET SESSIONS
Blue background = India session
Purple background = US session
Helps identify active trading hours
and avoid low volume periods.
9. ALERTS
Set alerts for all signals:
LOOK LONG / LOOK SHORT
Hammer / Shooting Star
Volume Spike
Bull/Bear Divergence
RSI Oversold/Overbought
10. SCORE SYSTEM
5-point scoring system:
Wave direction = 1 point
EMA alignment = 1 point
RSI direction = 1 point
ADX strength = 1 point
Volume confirm = 1 point
Score 3+ = signal confirmed
Score below 3 = stay out
HOW TO USE:
Wait for LOOK LONG or LOOK SHORT
with score 3 or higher.
Enter on hammer or star candle
confirmation at wave 2 or 4.
Use auto SL and TP lines shown.
Exit at 127% or 162% target.
Close before session ends.
SETTINGS:
Pivot Length - wave sensitivity
Toggle each feature on/off
Volume multiplier - spike threshold
ADX level - trend strength filter
RR Ratio - risk reward minimum
Session toggles for India and US
Works on all timeframes and
all markets including stocks
indices forex and crypto.
For educational purposes only.
Always use proper risk management.
Not financial advice.
Pine Script v6.
סקריפט קוד פתוח
ברוח האמיתית של TradingView, יוצר הסקריפט הזה הפך אותו לקוד פתוח, כך שסוחרים יוכלו לעיין בו ולאמת את פעולתו. כל הכבוד למחבר! אמנם ניתן להשתמש בו בחינם, אך זכור כי פרסום חוזר של הקוד כפוף ל־כללי הבית שלנו.

כתב ויתור
המידע והפרסומים אינם מיועדים להיות, ואינם מהווים, ייעוץ או המלצה פיננסית, השקעתית, מסחרית או מכל סוג אחר המסופקת או מאושרת על ידי TradingView. קרא עוד ב־תנאי השימוש.
סקריפט קוד פתוח
ברוח האמיתית של TradingView, יוצר הסקריפט הזה הפך אותו לקוד פתוח, כך שסוחרים יוכלו לעיין בו ולאמת את פעולתו. כל הכבוד למחבר! אמנם ניתן להשתמש בו בחינם, אך זכור כי פרסום חוזר של הקוד כפוף ל־כללי הבית שלנו.
כתב ויתור
המידע והפרסומים אינם מיועדים להיות, ואינם מהווים, ייעוץ או המלצה פיננסית, השקעתית, מסחרית או מכל סוג אחר המסופקת או מאושרת על ידי TradingView. קרא עוד ב־תנאי השימוש.