Historical Volatility Compression
Historical Volatility Compression
Historical Volatility Compression measures how unusually quiet the chart symbol is relative to its own available daily history. It combines close-to-close realized volatility with the total high-low price range, then expresses their combined compression as an expanding historical percentile.
A higher reading means the weighted volatility/range measure is more compressed relative to the recorded sample. This is a descriptive regime indicator, not a forecast of breakout direction, timing, probability or trading returns.
CALCULATION
All core calculations run in the chart symbol's daily context, even on intraday charts.
The optional RV and range component curves are 100 minus their respective empirical percentile ranks. The combined line ranks the weighted raw composite; it is not a weighted average of the two component percentiles.
REGIMES AND PERSISTENCE
The main line classifies values as:
These labels describe empirical rank bands. Ties, finite samples and changing available history mean they should not be interpreted as exact probabilities.
The dashboard tracks consecutive daily observations at or above 90, 95 and 99, plus the longest streak seen so far for each threshold. Persistence is 100 × the current ≥90 streak / the longest ≥90 streak observed so far, capped at 100. It is zero before any such streak. A 100 reading means the current streak matches or extends the historical maximum, even if the available record is short.
Duration labels are NONE when no ≥90 streak is active, EARLY below 40% persistence, PROLONGED from 40% to below 75%, VERY LONG from 75% to below 100%, and RECORD at 100%.
The headline becomes EXTREME + PERSISTENT when the percentile is at least 95 and the ≥90 streak lasts at least 14 daily observations; it becomes PERSISTENT at ≥90 with the same streak requirement. Otherwise, a one-observation drop of at least 10 percentile points gives VOL EXPANSION WATCH. This precedence means persistent states can take priority over an expansion-watch label.
CHANGE MEASURES
The dashboard shows changes over one and seven daily observations in percentile points, not percent returns.
Release here means a fall in the compression percentile. It does not require price to break a trading range.
INPUTS AND DEFAULTS
VISUALS
The separate pane contains a thick, regime-colored main percentile line, reference levels at 50, 90, 95 and 99, and optional component/persistence curves. Subtle orange, red and fuchsia backgrounds highlight ≥90, ≥95 and ≥99 regimes. The top-right dashboard reports the main state, component compression ranks, realized volatility, total range, streaks, persistence, changes and sample count. The raw composite is available in the Data Window.
ALERTS
Available alert conditions cover entry into the >=90, >=95 and >=99 regimes; exits below 99, 95 and 90; and a daily percentile-point change of -10 or lower.
Regime entry includes equality: a move from below 90 to exactly 90 qualifies. An exit requires moving from at or above the threshold to below it. Threshold alerts require a valid preceding chart-bar value; the first available reading after warmup does not itself trigger an entry alert. A jump across multiple thresholds can qualify for multiple separately configured alerts.
All alert conditions are evaluated at chart-bar close. The sharp-release event can qualify only once per requested daily observation during continuous script execution, even when its daily value is carried across many intraday bars or falls, recovers and falls again within the same observation. A different qualifying daily observation may generate a new event.
With Completed Daily Bars Only enabled on intraday charts, a newly available completed-daily result can trigger at the close of the first chart bar displaying it. On a daily chart, chart-close gating means the previous-day result is evaluated when the current daily chart bar closes.
Live mode remains the default. Closing an intraday chart bar does not confirm the developing daily input. Regime alerts may exit and re-enter on different chart bars within one day, and a live sharp-release alert can occur before a later recovery. Signals that occur only within a chart bar and disappear before its close do not trigger. Use Once Per Bar Close when creating alerts, and recreate existing TradingView alerts after updating the script or its settings.
REPAINTING, TIMEFRAMES AND LIMITATIONS
Live mode requests daily data with gaps_off and lookahead_off. It uses an unfinished daily bar: the main reading, colors, streaks, states and alerts can change intraday. Historical displays after reload can differ from what appeared live. No future daily close is intentionally exposed on historical bars.
Completed Daily Bars Only uses prior daily OHLC. On intraday charts, lookahead_on aligns these already-completed inputs to the start of the next daily period in both historical and realtime calculation. Live mode never enables lookahead_on. On daily and higher charts, lookahead_off remains in use. Completed mode is designed to avoid developing-daily changes on daily/intraday charts; revisions to market data, settings or available history can still change results. The script compiled and plotted in TradingView on daily and intraday charts. Completed-daily mode was also exercised in hourly Bar Replay. These checks do not establish trading performance or guarantee behavior across every feed and chart type.
Daily data requested on charts above one day is lower-timeframe data; the displayed series does not expose every intervening daily update. Prefer daily or intraday charts and interpret higher-timeframe charts cautiously.
“Days” in lookbacks and streaks means daily trading bars, not elapsed calendar days. Seven daily observations can span more than one week on markets that close. Warmup, limited history, invalid/nonpositive closes, data gaps and feed differences can affect availability and results. The script is best interpreted on standard price charts with positive prices. Separate component ranks can become available at different times.
Ranks and maximum streaks depend on the amount of history TradingView supplies. Loading more history or using another feed can change them. Persistently flat prices and repeated equal values require care because percentile ties and the logarithm floor affect interpretation.
Compression alone does not establish a profitable trade, predict breakout direction or promise an imminent move. The script has no entries, exits, position sizing or backtest performance statistics. The indicator runs independently and requires no imported Pine libraries.
TRON EXAMPLE
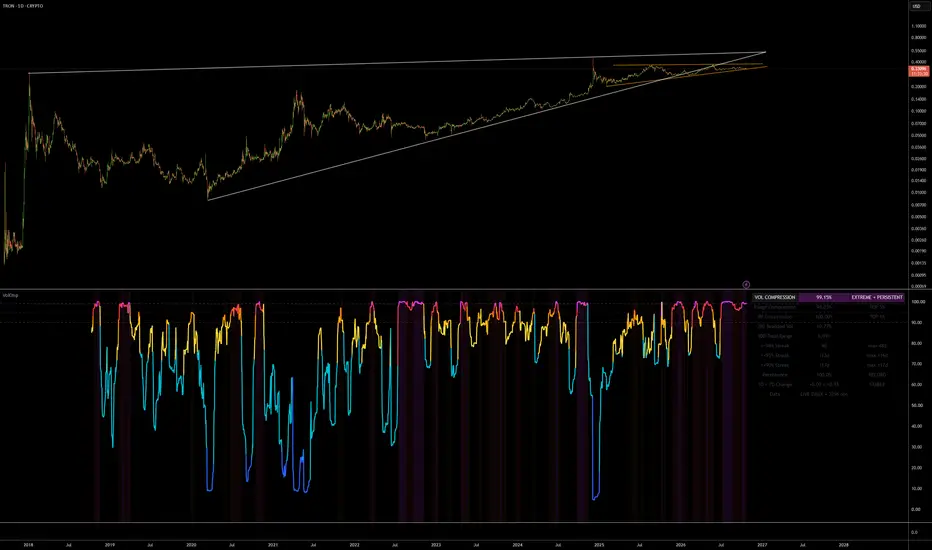
In the supplied TRON example, the indicator shows a Historical Compression Percentile of 99.15 and a 117-daily-bar streak at or above 90. The reading falls in the TOP 1% rank band; together with a >=90 streak longer than 14 bars, it meets the EXTREME + PERSISTENT headline condition. The 117-bar streak does not mean all 117 bars were above 99, and 99.15 is not a 99.15% breakout probability.
The screenshot uses live daily data, so its current reading and streak can change before the daily bar closes. The trendlines were drawn manually; they are not produced by this indicator and are not inputs to its calculations. This example illustrates interpretation of the displayed state, not a forecast or performance result.
Historical Volatility Compression measures how unusually quiet the chart symbol is relative to its own available daily history. It combines close-to-close realized volatility with the total high-low price range, then expresses their combined compression as an expanding historical percentile.
A higher reading means the weighted volatility/range measure is more compressed relative to the recorded sample. This is a descriptive regime indicator, not a forecast of breakout direction, timing, probability or trading returns.
CALCULATION
All core calculations run in the chart symbol's daily context, even on intraday charts.
- Realized volatility uses daily logarithmic close-to-close returns. The sample standard deviation over the selected period is multiplied by the square root of Annualization Days and by 100.
- Total range uses the highest high and lowest low over the same number of daily bars. Range width is 100 × (highest high − lowest low) / their midpoint.
- With w equal to Realized Volatility Weight % divided by 100, the raw composite is:
−[w × ln(max(realized volatility, 0.000001)) + (1 − w) × ln(max(range width, 0.000001))].
Lower volatility and narrower ranges therefore produce a higher raw score. The floor permits logarithms when a measure is zero. - Each valid raw composite is appended to an expanding array. Pine's array.percentrank ranks the current observation within that array, including the current value. The main percentile stays hidden until Minimum Historical Samples is reached. The history expands from available data; this is not a fixed rolling percentile window or a guarantee of the asset's complete lifetime history.
The optional RV and range component curves are 100 minus their respective empirical percentile ranks. The combined line ranks the weighted raw composite; it is not a weighted average of the two component percentiles.
REGIMES AND PERSISTENCE
The main line classifies values as:
- Below 25: EXPANDED, blue.
- 25 to below 75: NORMAL, aqua.
- 75 to below 90: HIGH, yellow.
- 90 to below 95: TOP 10%, orange.
- 95 to below 99: TOP 5%, red.
- 99 and above: TOP 1%, fuchsia.
These labels describe empirical rank bands. Ties, finite samples and changing available history mean they should not be interpreted as exact probabilities.
The dashboard tracks consecutive daily observations at or above 90, 95 and 99, plus the longest streak seen so far for each threshold. Persistence is 100 × the current ≥90 streak / the longest ≥90 streak observed so far, capped at 100. It is zero before any such streak. A 100 reading means the current streak matches or extends the historical maximum, even if the available record is short.
Duration labels are NONE when no ≥90 streak is active, EARLY below 40% persistence, PROLONGED from 40% to below 75%, VERY LONG from 75% to below 100%, and RECORD at 100%.
The headline becomes EXTREME + PERSISTENT when the percentile is at least 95 and the ≥90 streak lasts at least 14 daily observations; it becomes PERSISTENT at ≥90 with the same streak requirement. Otherwise, a one-observation drop of at least 10 percentile points gives VOL EXPANSION WATCH. This precedence means persistent states can take priority over an expansion-watch label.
CHANGE MEASURES
The dashboard shows changes over one and seven daily observations in percentile points, not percent returns.
- SHARP RELEASE: one-observation change ≤−10 or seven-observation change ≤−20.
- RELEASING: otherwise, change ≤−5 or ≤−10 respectively.
- SHARP COMPRESSION: otherwise, change ≥10 or ≥20 respectively.
- COMPRESSING: otherwise, change ≥5 or ≥10 respectively.
- Otherwise: STABLE.
Release here means a fall in the compression percentile. It does not require price to break a trading range.
INPUTS AND DEFAULTS
- Compression Period (Daily Bars): 30; allowed 5–365. Lookback for realized volatility and total range.
- Minimum Historical Samples: 365; allowed 60–5000. Minimum number of valid observations required for each rank. Calculation warmup comes before these observations accumulate.
- Realized Volatility Weight %: 40; allowed 0–100, step 5. The remaining 60% default weight goes to total range.
- Annualization Days: 365; allowed 1–365. Scales displayed annualized realized volatility; 252 is a conventional weekday-market alternative. Away from the numerical floor, a constant rescaling of RV does not change percentile ordering.
- Completed Daily Bars Only: off. Off uses the developing daily observation. On uses previous daily OHLC inputs and therefore introduces a delay.
- Show RV Compression, Show Range Compression, Show Persistence Score: off.
- Highlight Extreme Regimes and Show Dashboard: on.
VISUALS
The separate pane contains a thick, regime-colored main percentile line, reference levels at 50, 90, 95 and 99, and optional component/persistence curves. Subtle orange, red and fuchsia backgrounds highlight ≥90, ≥95 and ≥99 regimes. The top-right dashboard reports the main state, component compression ranks, realized volatility, total range, streaks, persistence, changes and sample count. The raw composite is available in the Data Window.
ALERTS
Available alert conditions cover entry into the >=90, >=95 and >=99 regimes; exits below 99, 95 and 90; and a daily percentile-point change of -10 or lower.
Regime entry includes equality: a move from below 90 to exactly 90 qualifies. An exit requires moving from at or above the threshold to below it. Threshold alerts require a valid preceding chart-bar value; the first available reading after warmup does not itself trigger an entry alert. A jump across multiple thresholds can qualify for multiple separately configured alerts.
All alert conditions are evaluated at chart-bar close. The sharp-release event can qualify only once per requested daily observation during continuous script execution, even when its daily value is carried across many intraday bars or falls, recovers and falls again within the same observation. A different qualifying daily observation may generate a new event.
With Completed Daily Bars Only enabled on intraday charts, a newly available completed-daily result can trigger at the close of the first chart bar displaying it. On a daily chart, chart-close gating means the previous-day result is evaluated when the current daily chart bar closes.
Live mode remains the default. Closing an intraday chart bar does not confirm the developing daily input. Regime alerts may exit and re-enter on different chart bars within one day, and a live sharp-release alert can occur before a later recovery. Signals that occur only within a chart bar and disappear before its close do not trigger. Use Once Per Bar Close when creating alerts, and recreate existing TradingView alerts after updating the script or its settings.
REPAINTING, TIMEFRAMES AND LIMITATIONS
Live mode requests daily data with gaps_off and lookahead_off. It uses an unfinished daily bar: the main reading, colors, streaks, states and alerts can change intraday. Historical displays after reload can differ from what appeared live. No future daily close is intentionally exposed on historical bars.
Completed Daily Bars Only uses prior daily OHLC. On intraday charts, lookahead_on aligns these already-completed inputs to the start of the next daily period in both historical and realtime calculation. Live mode never enables lookahead_on. On daily and higher charts, lookahead_off remains in use. Completed mode is designed to avoid developing-daily changes on daily/intraday charts; revisions to market data, settings or available history can still change results. The script compiled and plotted in TradingView on daily and intraday charts. Completed-daily mode was also exercised in hourly Bar Replay. These checks do not establish trading performance or guarantee behavior across every feed and chart type.
Daily data requested on charts above one day is lower-timeframe data; the displayed series does not expose every intervening daily update. Prefer daily or intraday charts and interpret higher-timeframe charts cautiously.
“Days” in lookbacks and streaks means daily trading bars, not elapsed calendar days. Seven daily observations can span more than one week on markets that close. Warmup, limited history, invalid/nonpositive closes, data gaps and feed differences can affect availability and results. The script is best interpreted on standard price charts with positive prices. Separate component ranks can become available at different times.
Ranks and maximum streaks depend on the amount of history TradingView supplies. Loading more history or using another feed can change them. Persistently flat prices and repeated equal values require care because percentile ties and the logarithm floor affect interpretation.
Compression alone does not establish a profitable trade, predict breakout direction or promise an imminent move. The script has no entries, exits, position sizing or backtest performance statistics. The indicator runs independently and requires no imported Pine libraries.
TRON EXAMPLE
In the supplied TRON example, the indicator shows a Historical Compression Percentile of 99.15 and a 117-daily-bar streak at or above 90. The reading falls in the TOP 1% rank band; together with a >=90 streak longer than 14 bars, it meets the EXTREME + PERSISTENT headline condition. The 117-bar streak does not mean all 117 bars were above 99, and 99.15 is not a 99.15% breakout probability.
The screenshot uses live daily data, so its current reading and streak can change before the daily bar closes. The trendlines were drawn manually; they are not produced by this indicator and are not inputs to its calculations. This example illustrates interpretation of the displayed state, not a forecast or performance result.

Looking for a dev? I offer Pine Script, Solidity smart contracts, AI and full-stack development, plus quantitative research, technical analysis and Elliott Wave/NEoWave analysis. Tell us about your project at fractuition.tech
כתב ויתור
המידע והפרסומים אינם מיועדים להיות, ואינם מהווים, ייעוץ או המלצה פיננסית, השקעתית, מסחרית או מכל סוג אחר המסופקת או מאושרת על ידי TradingView. קרא עוד ב־תנאי השימוש.
Looking for a dev? I offer Pine Script, Solidity smart contracts, AI and full-stack development, plus quantitative research, technical analysis and Elliott Wave/NEoWave analysis. Tell us about your project at fractuition.tech
כתב ויתור
המידע והפרסומים אינם מיועדים להיות, ואינם מהווים, ייעוץ או המלצה פיננסית, השקעתית, מסחרית או מכל סוג אחר המסופקת או מאושרת על ידי TradingView. קרא עוד ב־תנאי השימוש.