Multi-Period Volume Profile Levels
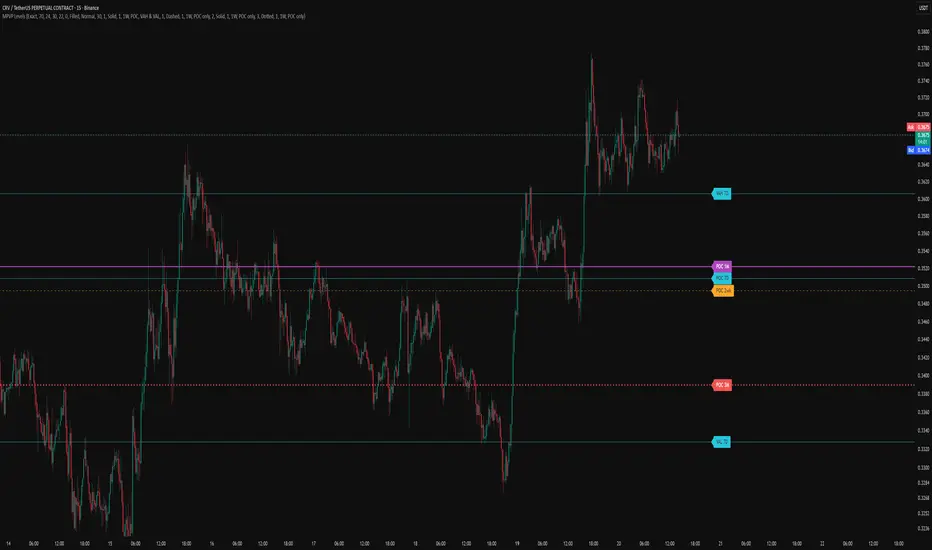
Multi-Period Volume Profile Levels automatically plots the Point of Control (POC), Value Area High (VAH) and Value Area Low (VAL) for four rolling periods: 7 days, 2 weeks, 1 month and 3 months. It saves you redrawing Fixed Range Volume Profiles by hand and keeps the key levels from several time horizons on one chart.
HOW IT WORKS
For each period, the script builds a volume profile from lower timeframe bars (30 minutes by default). Each bar's volume is spread across the price rows its range covers. The row with the most volume is the POC. The value area is then built outward from the POC, adding whichever neighbouring row holds more volume, until it contains the chosen percentage of total volume (70% by default). The top and bottom of that area are the VAH and VAL. This follows the same method as TradingView's Fixed Range Volume Profile, so levels should land very close to an FRVP drawn over the same range.
PERIOD MODES
Exact: rolling windows of 7 days, 14 days, 1 calendar month and 3 calendar months back from the current session open, snapped to the nearest daily open.
Start of week: periods are anchored to session opens. The 7 day profile starts at the previous week's open, so it grows from one week to nearly two through the week and resets to exactly one week at the next weekly open. 2 weeks works the same way from two weeks back, and 1 month and 3 months are anchored to monthly opens.
The week open follows the symbol's own weekly session (Sunday evening UK time for FX). A custom week open (Sunday, UK time) is available for markets that trade through the weekend, such as crypto.
FEATURES
- Each period has its own colour, line width and line style (solid, dashed or dotted), so levels are easy to tell apart.
- Each period can be switched on or off and limited to a range of chart timeframes, for example 7 day levels on 5m and 15m charts only, and the longer periods on higher timeframes.
- Each period can show POC only, VAH and VAL only, or all three.
- Labels such as "POC 7D" or "VAL 2wk" sit to the right of price at an adjustable offset, and pin to the right edge of the chart when you scroll back through history.
- Coloured price badges on the price scale show each level's value. To show the level names on the badges as well, right-click the price scale, then Labels, then tick "Indicators and financials name labels".
- "(partial)" is added to a label if the symbol doesn't have enough history to cover the full period. Raising the calculation timeframe usually fixes this.
ALERTS
One alert covers all levels. Create an alert, choose this indicator as the condition and select "Any alert() function call". It fires when a candle reaches a level that the previous candle did not touch, so you get one alert as price arrives rather than one on every candle. POC and VAH/VAL alerts can be switched on or off separately, and by default only levels currently displayed on the chart can trigger. If several levels are touched at once, they arrive in a single message.
SETTINGS TIPS
- Profile rows (default 24) matches the FRVP default. More rows gives finer levels.
- A lower calculation timeframe is more precise but has less history available. If 3 month levels show "(partial)", try 60 minutes.
- Levels are calculated from the latest data only, so they update as new volume comes in and do not show where they sat historically.
This indicator is for analysis and educational purposes only and is not financial advice.
HOW IT WORKS
For each period, the script builds a volume profile from lower timeframe bars (30 minutes by default). Each bar's volume is spread across the price rows its range covers. The row with the most volume is the POC. The value area is then built outward from the POC, adding whichever neighbouring row holds more volume, until it contains the chosen percentage of total volume (70% by default). The top and bottom of that area are the VAH and VAL. This follows the same method as TradingView's Fixed Range Volume Profile, so levels should land very close to an FRVP drawn over the same range.
PERIOD MODES
Exact: rolling windows of 7 days, 14 days, 1 calendar month and 3 calendar months back from the current session open, snapped to the nearest daily open.
Start of week: periods are anchored to session opens. The 7 day profile starts at the previous week's open, so it grows from one week to nearly two through the week and resets to exactly one week at the next weekly open. 2 weeks works the same way from two weeks back, and 1 month and 3 months are anchored to monthly opens.
The week open follows the symbol's own weekly session (Sunday evening UK time for FX). A custom week open (Sunday, UK time) is available for markets that trade through the weekend, such as crypto.
FEATURES
- Each period has its own colour, line width and line style (solid, dashed or dotted), so levels are easy to tell apart.
- Each period can be switched on or off and limited to a range of chart timeframes, for example 7 day levels on 5m and 15m charts only, and the longer periods on higher timeframes.
- Each period can show POC only, VAH and VAL only, or all three.
- Labels such as "POC 7D" or "VAL 2wk" sit to the right of price at an adjustable offset, and pin to the right edge of the chart when you scroll back through history.
- Coloured price badges on the price scale show each level's value. To show the level names on the badges as well, right-click the price scale, then Labels, then tick "Indicators and financials name labels".
- "(partial)" is added to a label if the symbol doesn't have enough history to cover the full period. Raising the calculation timeframe usually fixes this.
ALERTS
One alert covers all levels. Create an alert, choose this indicator as the condition and select "Any alert() function call". It fires when a candle reaches a level that the previous candle did not touch, so you get one alert as price arrives rather than one on every candle. POC and VAH/VAL alerts can be switched on or off separately, and by default only levels currently displayed on the chart can trigger. If several levels are touched at once, they arrive in a single message.
SETTINGS TIPS
- Profile rows (default 24) matches the FRVP default. More rows gives finer levels.
- A lower calculation timeframe is more precise but has less history available. If 3 month levels show "(partial)", try 60 minutes.
- Levels are calculated from the latest data only, so they update as new volume comes in and do not show where they sat historically.
This indicator is for analysis and educational purposes only and is not financial advice.

כתב ויתור
המידע והפרסומים אינם מיועדים להיות, ואינם מהווים, ייעוץ או המלצה פיננסית, השקעתית, מסחרית או מכל סוג אחר המסופקת או מאושרת על ידי TradingView. קרא עוד ב־תנאי השימוש.
כתב ויתור
המידע והפרסומים אינם מיועדים להיות, ואינם מהווים, ייעוץ או המלצה פיננסית, השקעתית, מסחרית או מכל סוג אחר המסופקת או מאושרת על ידי TradingView. קרא עוד ב־תנאי השימוש.