OPEN-SOURCE SCRIPT
20/200 Simple Moving Average
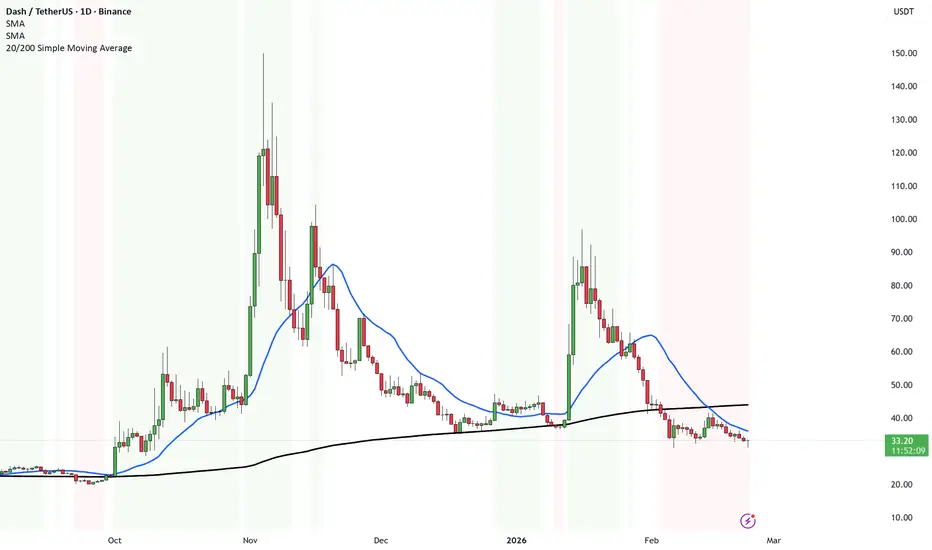
This indicator shows you the big trend vs the medium trend — and colors the chart so you don’t have to think too much.
Here’s what it does in simple terms:
What are the two lines?
20 SMA = the average price of the last 20 candles → short/medium-term direction.
200 SMA = the average price of the last 200 candles → long-term trend.
Think of it like:
20 = recent behavior.
200 = overall direction.
What the Background Colors Mean
🟢 Green Background
Price is ABOVE both the 20 and the 200.
That means:
Short-term trend is strong.
Long-term trend is bullish.
Market structure is healthy.
This is bullish territory.
🔴 Red Background
Price is BELOW both the 20 and the 200.
That means:
Short-term trend is weak.
Long-term trend is bearish.
Sellers are in control.
This is bearish territory.
⚪ White / No Color
Price is stuck between the two averages.
That means:
No clear trend.
Market is deciding.
Higher chance of chop.
Buy & Sell Signals (Crossovers)
Buy Territory:
When the 20 crosses ABOVE the 200 and price is already above the 200.
That’s momentum shifting bullish inside a confirmed trend.
Sell Territory:
When the 20 crosses BELOW the 200 and price is already below the 200.
That’s momentum turning bearish in a downtrend.
In very simple words:
Green = strong uptrend.
Red = strong downtrend.
White = messy middle.
Here’s what it does in simple terms:
What are the two lines?
20 SMA = the average price of the last 20 candles → short/medium-term direction.
200 SMA = the average price of the last 200 candles → long-term trend.
Think of it like:
20 = recent behavior.
200 = overall direction.
What the Background Colors Mean
🟢 Green Background
Price is ABOVE both the 20 and the 200.
That means:
Short-term trend is strong.
Long-term trend is bullish.
Market structure is healthy.
This is bullish territory.
🔴 Red Background
Price is BELOW both the 20 and the 200.
That means:
Short-term trend is weak.
Long-term trend is bearish.
Sellers are in control.
This is bearish territory.
⚪ White / No Color
Price is stuck between the two averages.
That means:
No clear trend.
Market is deciding.
Higher chance of chop.
Buy & Sell Signals (Crossovers)
Buy Territory:
When the 20 crosses ABOVE the 200 and price is already above the 200.
That’s momentum shifting bullish inside a confirmed trend.
Sell Territory:
When the 20 crosses BELOW the 200 and price is already below the 200.
That’s momentum turning bearish in a downtrend.
In very simple words:
Green = strong uptrend.
Red = strong downtrend.
White = messy middle.
סקריפט קוד פתוח
ברוח האמיתית של TradingView, יוצר הסקריפט הזה הפך אותו לקוד פתוח, כך שסוחרים יוכלו לעיין בו ולאמת את פעולתו. כל הכבוד למחבר! אמנם ניתן להשתמש בו בחינם, אך זכור כי פרסום חוזר של הקוד כפוף ל־כללי הבית שלנו.

🌐NEW Website 2025:
mati-trader.lovable.app/
✅ Facebook:
facebook.com/groups/matitrader
𝕏 (Formerly Twitter):
twitter.com/timonr
Trade Well,
Timon Rossolimos
Founder, MATI Trader
(Pro trader since 2003)
mati-trader.lovable.app/
✅ Facebook:
facebook.com/groups/matitrader
𝕏 (Formerly Twitter):
twitter.com/timonr
Trade Well,
Timon Rossolimos
Founder, MATI Trader
(Pro trader since 2003)
כתב ויתור
המידע והפרסומים אינם מיועדים להיות, ואינם מהווים, ייעוץ או המלצה פיננסית, השקעתית, מסחרית או מכל סוג אחר המסופקת או מאושרת על ידי TradingView. קרא עוד ב־תנאי השימוש.
סקריפט קוד פתוח
ברוח האמיתית של TradingView, יוצר הסקריפט הזה הפך אותו לקוד פתוח, כך שסוחרים יוכלו לעיין בו ולאמת את פעולתו. כל הכבוד למחבר! אמנם ניתן להשתמש בו בחינם, אך זכור כי פרסום חוזר של הקוד כפוף ל־כללי הבית שלנו.
🌐NEW Website 2025:
mati-trader.lovable.app/
✅ Facebook:
facebook.com/groups/matitrader
𝕏 (Formerly Twitter):
twitter.com/timonr
Trade Well,
Timon Rossolimos
Founder, MATI Trader
(Pro trader since 2003)
mati-trader.lovable.app/
✅ Facebook:
facebook.com/groups/matitrader
𝕏 (Formerly Twitter):
twitter.com/timonr
Trade Well,
Timon Rossolimos
Founder, MATI Trader
(Pro trader since 2003)
כתב ויתור
המידע והפרסומים אינם מיועדים להיות, ואינם מהווים, ייעוץ או המלצה פיננסית, השקעתית, מסחרית או מכל סוג אחר המסופקת או מאושרת על ידי TradingView. קרא עוד ב־תנאי השימוש.