Liquidity Contour Map [AlgoNorth]
Liquidity Contour Map
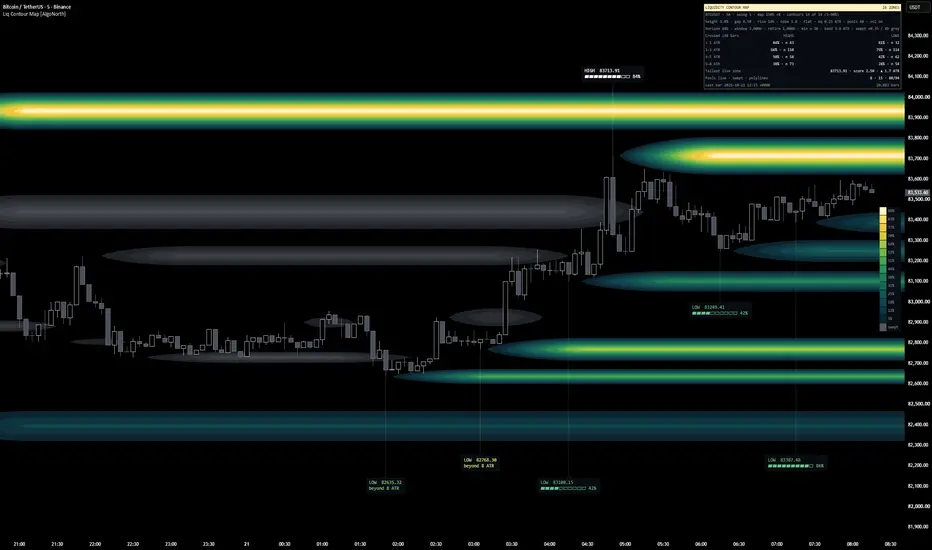
Every swing high and low marks a pool of liquidity. Yet on a plain chart, a level left by one quiet candle looks exactly like one tested four times on heavy volume. This script tells them apart. It scores each pool and draws it as a layered contour zone around its price. The higher the score, the brighter the core.
The score comes from two things: the volume of the swing candle and how many swings formed at the same level. Colour marks pools that are still live. Grey marks pools price has already swept, each one closing off just after its sweep. Tags on the highest-scoring zones show how often pools at the same distance were crossed within 48 bars on your chart, and the panel keeps count.
🔶 USAGE
🔸 Read the score. Colour carries the score: the brighter a zone's core, the higher its pool's score. The legend gives each contour as a % of the highest score on the map, with a grey row for swept zones. Zones that overlap in time share the space between them, so a zone is trimmed where pools sit close together; the colour still shows the score.
🔸 Live and swept. Live zones run 8 bars past the last candle. A pool that price has traded through is drawn in grey, its score cut to 35% so it carries fewer bands, and its zone closes off 8 bars after the sweep.
🔸 Read the tags. By default, up to six tags, on the highest-scoring live zones first, then swept ones. Line 1 names the pool, HIGH or LOW, or EQH×3 / EQL×2 when several swings formed at the same level, with its price. Line 2 on a live pool is a 10-block meter and the % of past windows on same-side pools in its distance band that were crossed within 48 bars; on a swept pool it says how many bars ago it was swept. A dotted stem joins each tag to its swing candle. Only zones whose swing candle is on the map are tagged, and tags are pushed clear of zones and other tags, so in a crowded map a stem can run a long way.
🔸 Hover a tag for the detail: the window count, time to sweep, the distance band, distance in ATR, the score and its rank on the map, swing volume against its average, and age.
🔸 Read the panel. The first rows show the live settings. Below them: the crossing rate for highs and lows in four distance rows, each with its window count (n); the tallest live zone with its score and distance; live and swept pool counts with the polylines used; and the last bar with the bar count, so you can see it update.
🔸 Two looks. Flat contours: clean concentric bands. 3D contours: lit ring edges, slope shading and a ground shadow. Colours switch automatically between dark and light chart backgrounds.
🔶 DETAILS
🔸 Pools. A swing high or low with 5 bars each side, confirmed 5 bars after the swing candle. A new swing within 0.25 ATR of a live pool on the same side joins that pool as an equal high or low (EQH / EQL) and keeps the first swing's price and candle. ATR is a 100-bar average true range. Up to 60 pools are tracked; when the list is full, the pool furthest outside the relevance band goes first, then the oldest. A swept pool is dropped once its zone has left the map, and any pool older than 4,900 bars is dropped.
🔸 Sweeps. A pool is swept when a closed bar trades beyond it, gaps included: a high above a swing high, or a low below a swing low. Matching it exactly doesn't count.
🔸 Score. Swing volume × touches × build-up. Volume is the swing candle's volume against the average of the 50 bars before it, clamped to 0.5–2.5×; in an equal high or low, the heaviest swing counts. With no volume data, or with Scale by swing volume off, every swing counts as average. Each extra swing at the level adds 0.5×, up to 2.5× at the 4th. A pool's score builds from zero at its swing candle to its full value 14 bars later, so it appears part-built when it is confirmed. The score runs from 0 to 6.25 (2.50 without volume). A swept pool keeps the score it had on its sweep bar, × 0.35.
🔸 Read from price and volume. The score is a proxy: swing highs and lows stand in for where orders are assumed to rest, and the swing's volume for how heavily it traded. No order book data is used.
🔸 The map. It covers the last 150 bars. A zone starts at its swing candle, or at the map's left edge for older pools, and reaches up to 9% of the map's high–low range above and below its price. Pools more than 3 ATR beyond the map's high or low aren't drawn. Up to 14 contour bands are spaced evenly from 5% to 90% of the highest score inside the map's range, so a high-scoring pool far off-screen can't wash the map out; higher-scoring pools further out top out at the top colour.
🔸 Spacing. Zones that share bars are trimmed to half the gap between them, so no two touch. When two pools sit closer than 0.5 half-heights, the lower-scoring zone is hidden; a swept pool competes at its pre-sweep score. A pool is also left off when its score is below the lowest contour or its zone is too short to draw a smooth outline.
🔸 Polyline budget. TradingView allows a script 100 polylines, and tag stems are reserved first. If not every contour fits, the most that fit are drawn, evenly spaced from the lowest to the top, and the panel shows how many more were needed ("short").
🔸 Crossing windows. Each live pool is watched in back-to-back 48-bar windows. A window counts as crossed if price traded beyond the pool before it ended, gaps included. It is filed by side and by the pool's distance from the close when it opened: under 0.5, 0.5–1, 1–2, 2–3, 3–5 or 5–8 ATR. Windows open only for pools inside the relevance band, within 8 ATR and young enough to finish before the pool is 1,000 bars old. Once open, a window always runs to its end, even if its pool is dropped. Only windows that ended in the last 3,000 bars are counted.
🔸 Reading the rates. Below 30 windows a band shows no %. The panel merges the six bands into four rows (under 1 ATR, 1–3, 3–5, 5–8), while a tag uses its pool's own band, so a tag's % can differ from its panel row. A tag shows the band its pool sits in now, so its number changes when price moves the pool into another band. n counts windows, not pools: a long-lived pool opens one window after another. Nearer pools are crossed more often by construction, so the rates mostly reflect how far price tends to travel in 48 bars on your chart. They are counts over the loaded history, not a forecast and not a backtest.
🔸 Time to sweep. Among a band's crossed windows, the median number of bars to the cross. It shows once the band has its minimum sample and at least 10 of its windows were crossed.
🔶 SETTINGS
🔸 Pools: Swing length, Equal high / low tolerance, Max pools tracked, Relevance band.
🔸 Score: Bars to full height, Swept pool height, Grey swept zones, Swept run-on, Scale by swing volume.
🔸 Map: Map width, Max zone half-height, Min zone gap, Contour levels, Lowest contour, Top contour, Extend right, Nose roundness.
🔸 Look: Flat or 3D contours, and for 3D: lit ring edges, edge width, slope shading, shading strength, ground shadow.
🔸 Callouts: Show callouts, Max callouts, Tag size.
🔸 History stats: Horizon, Window, Retire after, Minimum sample.
🔸 Style: Contour transparency, Score legend, Legend position.
🔸 Panel: Show panel, Panel position, Text size. Four corners, so the panel can sit clear of price or of a second copy.
🔶 NOTES
🔸 This is a context tool. It shows where swing liquidity sits, how each pool scores and how often levels at each distance were crossed on your chart; it doesn't give buy or sell signals.
🔸 A pool is only confirmed 5 bars (Swing length) after its swing high or low. Once confirmed, its zone and tag start from the swing candle itself. So when you scroll back through history, a zone looks like it began at the swing, but live it only appeared 5 bars later. Nothing appears until that confirmation.
🔸 The map is a snapshot of the present, like a volume profile. It shows the pools alive at the latest close, sized and coloured from that close. It isn't a record of how the map looked on earlier bars, so scrolling back shows today's snapshot over older candles. The snapshot changes as pools form and get swept: a new pool close to an old one gives each a narrower zone, and a swept pool shows in grey along its whole length. A pool's price never moves once it appears.
🔸 Pools, sweeps and the stats update when a bar closes, so a pool crossed during the forming bar is drawn in grey from that bar's close.
🔸 Liquidity is read from price and the chart's own volume. Swing highs and lows stand in for where orders are assumed to rest; no order book data is used.
🔸 The rates come from the bars loaded on your chart, so each symbol and timeframe shows its own numbers. A band built on a few dozen windows can move noticeably from week to week, which is why every rate shows its n.
🔸 Made for standard candle and bar charts. On Heikin Ashi, Renko, Kagi and similar chart types the stats switch off and the panel says so; the zones are still drawn, from that chart type's calculated prices.
🔶 SUMMARY
On a plain chart every swing high and low looks the same. Liquidity Contour Map scores each pool on its swing volume and the swings that formed at the same level, and shows it as a layered contour zone: the higher the score, the brighter the core. Colour marks live pools, grey marks swept ones, and the tags and panel show how often pools at each distance were crossed on your chart.
Every swing high and low marks a pool of liquidity. Yet on a plain chart, a level left by one quiet candle looks exactly like one tested four times on heavy volume. This script tells them apart. It scores each pool and draws it as a layered contour zone around its price. The higher the score, the brighter the core.
The score comes from two things: the volume of the swing candle and how many swings formed at the same level. Colour marks pools that are still live. Grey marks pools price has already swept, each one closing off just after its sweep. Tags on the highest-scoring zones show how often pools at the same distance were crossed within 48 bars on your chart, and the panel keeps count.
🔶 USAGE
🔸 Read the score. Colour carries the score: the brighter a zone's core, the higher its pool's score. The legend gives each contour as a % of the highest score on the map, with a grey row for swept zones. Zones that overlap in time share the space between them, so a zone is trimmed where pools sit close together; the colour still shows the score.
🔸 Live and swept. Live zones run 8 bars past the last candle. A pool that price has traded through is drawn in grey, its score cut to 35% so it carries fewer bands, and its zone closes off 8 bars after the sweep.
🔸 Read the tags. By default, up to six tags, on the highest-scoring live zones first, then swept ones. Line 1 names the pool, HIGH or LOW, or EQH×3 / EQL×2 when several swings formed at the same level, with its price. Line 2 on a live pool is a 10-block meter and the % of past windows on same-side pools in its distance band that were crossed within 48 bars; on a swept pool it says how many bars ago it was swept. A dotted stem joins each tag to its swing candle. Only zones whose swing candle is on the map are tagged, and tags are pushed clear of zones and other tags, so in a crowded map a stem can run a long way.
🔸 Hover a tag for the detail: the window count, time to sweep, the distance band, distance in ATR, the score and its rank on the map, swing volume against its average, and age.
🔸 Read the panel. The first rows show the live settings. Below them: the crossing rate for highs and lows in four distance rows, each with its window count (n); the tallest live zone with its score and distance; live and swept pool counts with the polylines used; and the last bar with the bar count, so you can see it update.
🔸 Two looks. Flat contours: clean concentric bands. 3D contours: lit ring edges, slope shading and a ground shadow. Colours switch automatically between dark and light chart backgrounds.
🔶 DETAILS
🔸 Pools. A swing high or low with 5 bars each side, confirmed 5 bars after the swing candle. A new swing within 0.25 ATR of a live pool on the same side joins that pool as an equal high or low (EQH / EQL) and keeps the first swing's price and candle. ATR is a 100-bar average true range. Up to 60 pools are tracked; when the list is full, the pool furthest outside the relevance band goes first, then the oldest. A swept pool is dropped once its zone has left the map, and any pool older than 4,900 bars is dropped.
🔸 Sweeps. A pool is swept when a closed bar trades beyond it, gaps included: a high above a swing high, or a low below a swing low. Matching it exactly doesn't count.
🔸 Score. Swing volume × touches × build-up. Volume is the swing candle's volume against the average of the 50 bars before it, clamped to 0.5–2.5×; in an equal high or low, the heaviest swing counts. With no volume data, or with Scale by swing volume off, every swing counts as average. Each extra swing at the level adds 0.5×, up to 2.5× at the 4th. A pool's score builds from zero at its swing candle to its full value 14 bars later, so it appears part-built when it is confirmed. The score runs from 0 to 6.25 (2.50 without volume). A swept pool keeps the score it had on its sweep bar, × 0.35.
🔸 Read from price and volume. The score is a proxy: swing highs and lows stand in for where orders are assumed to rest, and the swing's volume for how heavily it traded. No order book data is used.
🔸 The map. It covers the last 150 bars. A zone starts at its swing candle, or at the map's left edge for older pools, and reaches up to 9% of the map's high–low range above and below its price. Pools more than 3 ATR beyond the map's high or low aren't drawn. Up to 14 contour bands are spaced evenly from 5% to 90% of the highest score inside the map's range, so a high-scoring pool far off-screen can't wash the map out; higher-scoring pools further out top out at the top colour.
🔸 Spacing. Zones that share bars are trimmed to half the gap between them, so no two touch. When two pools sit closer than 0.5 half-heights, the lower-scoring zone is hidden; a swept pool competes at its pre-sweep score. A pool is also left off when its score is below the lowest contour or its zone is too short to draw a smooth outline.
🔸 Polyline budget. TradingView allows a script 100 polylines, and tag stems are reserved first. If not every contour fits, the most that fit are drawn, evenly spaced from the lowest to the top, and the panel shows how many more were needed ("short").
🔸 Crossing windows. Each live pool is watched in back-to-back 48-bar windows. A window counts as crossed if price traded beyond the pool before it ended, gaps included. It is filed by side and by the pool's distance from the close when it opened: under 0.5, 0.5–1, 1–2, 2–3, 3–5 or 5–8 ATR. Windows open only for pools inside the relevance band, within 8 ATR and young enough to finish before the pool is 1,000 bars old. Once open, a window always runs to its end, even if its pool is dropped. Only windows that ended in the last 3,000 bars are counted.
🔸 Reading the rates. Below 30 windows a band shows no %. The panel merges the six bands into four rows (under 1 ATR, 1–3, 3–5, 5–8), while a tag uses its pool's own band, so a tag's % can differ from its panel row. A tag shows the band its pool sits in now, so its number changes when price moves the pool into another band. n counts windows, not pools: a long-lived pool opens one window after another. Nearer pools are crossed more often by construction, so the rates mostly reflect how far price tends to travel in 48 bars on your chart. They are counts over the loaded history, not a forecast and not a backtest.
🔸 Time to sweep. Among a band's crossed windows, the median number of bars to the cross. It shows once the band has its minimum sample and at least 10 of its windows were crossed.
🔶 SETTINGS
🔸 Pools: Swing length, Equal high / low tolerance, Max pools tracked, Relevance band.
🔸 Score: Bars to full height, Swept pool height, Grey swept zones, Swept run-on, Scale by swing volume.
🔸 Map: Map width, Max zone half-height, Min zone gap, Contour levels, Lowest contour, Top contour, Extend right, Nose roundness.
🔸 Look: Flat or 3D contours, and for 3D: lit ring edges, edge width, slope shading, shading strength, ground shadow.
🔸 Callouts: Show callouts, Max callouts, Tag size.
🔸 History stats: Horizon, Window, Retire after, Minimum sample.
🔸 Style: Contour transparency, Score legend, Legend position.
🔸 Panel: Show panel, Panel position, Text size. Four corners, so the panel can sit clear of price or of a second copy.
🔶 NOTES
🔸 This is a context tool. It shows where swing liquidity sits, how each pool scores and how often levels at each distance were crossed on your chart; it doesn't give buy or sell signals.
🔸 A pool is only confirmed 5 bars (Swing length) after its swing high or low. Once confirmed, its zone and tag start from the swing candle itself. So when you scroll back through history, a zone looks like it began at the swing, but live it only appeared 5 bars later. Nothing appears until that confirmation.
🔸 The map is a snapshot of the present, like a volume profile. It shows the pools alive at the latest close, sized and coloured from that close. It isn't a record of how the map looked on earlier bars, so scrolling back shows today's snapshot over older candles. The snapshot changes as pools form and get swept: a new pool close to an old one gives each a narrower zone, and a swept pool shows in grey along its whole length. A pool's price never moves once it appears.
🔸 Pools, sweeps and the stats update when a bar closes, so a pool crossed during the forming bar is drawn in grey from that bar's close.
🔸 Liquidity is read from price and the chart's own volume. Swing highs and lows stand in for where orders are assumed to rest; no order book data is used.
🔸 The rates come from the bars loaded on your chart, so each symbol and timeframe shows its own numbers. A band built on a few dozen windows can move noticeably from week to week, which is why every rate shows its n.
🔸 Made for standard candle and bar charts. On Heikin Ashi, Renko, Kagi and similar chart types the stats switch off and the panel says so; the zones are still drawn, from that chart type's calculated prices.
🔶 SUMMARY
On a plain chart every swing high and low looks the same. Liquidity Contour Map scores each pool on its swing volume and the swings that formed at the same level, and shows it as a layered contour zone: the higher the score, the brighter the core. Colour marks live pools, grey marks swept ones, and the tags and panel show how often pools at each distance were crossed on your chart.

כתב ויתור
המידע והפרסומים אינם מיועדים להיות, ואינם מהווים, ייעוץ או המלצה פיננסית, השקעתית, מסחרית או מכל סוג אחר המסופקת או מאושרת על ידי TradingView. קרא עוד ב־תנאי השימוש.
כתב ויתור
המידע והפרסומים אינם מיועדים להיות, ואינם מהווים, ייעוץ או המלצה פיננסית, השקעתית, מסחרית או מכל סוג אחר המסופקת או מאושרת על ידי TradingView. קרא עוד ב־תנאי השימוש.