OPEN-SOURCE SCRIPT
מעודכן RSI Return Study
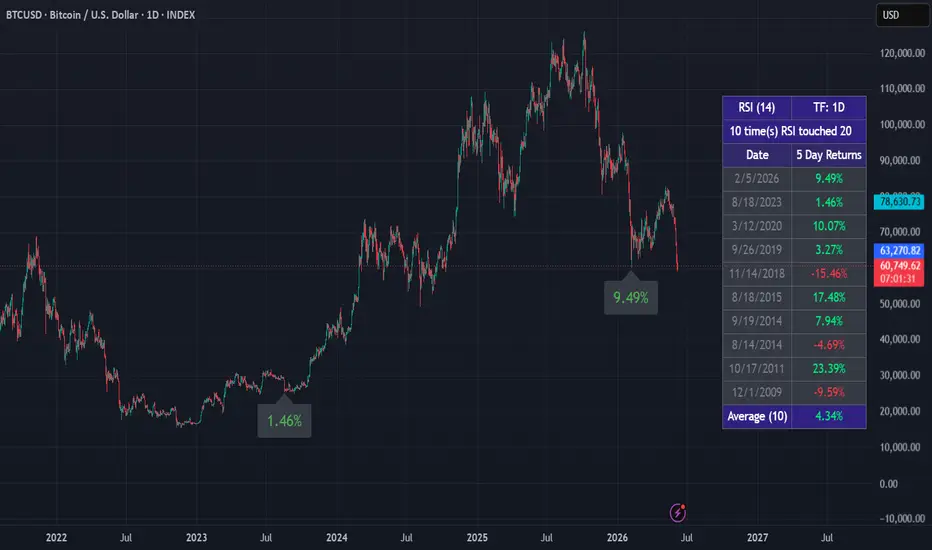
Ever wonder what happens after the RSI hits an extreme level on your favorite ticker? This indicator answers that question historically.
What it does:
How to use:
Notes:
What it does:
- Finds every instance where the RSI crossed a user-defined trigger level
- Measures the forward price return N trading days later
- Displays each signal date and return in a clean table
- Plots labels on the chart at each signal location
- Shows the average return across all historical signals
How to use:
- Set "When RSI Touches..." to your oversold level (e.g. 25) or overbought level (e.g. 75)
- Set "Calculate Return Days Later" to how many trading days forward you want to measure
- Works on any timeframe — bar count is automatically calculated for you
- Adjust "Max Results/Labels to Display" to control how much shows on the chart
Notes:
- All signals are included in the average regardless of the display limit
- Set "Min Bars Between Signals" to 0 to count every RSI cross, or increase it to reduce clustering during volatile periods
הערות שחרור
Added the ability to see more than one forward return. For example, can now input"1D,3D,7D" or
"5D,1M,3M,6M,1Y"
Can support up to 5 forward returns.
סקריפט קוד פתוח
ברוח האמיתית של TradingView, יוצר הסקריפט הזה הפך אותו לקוד פתוח, כך שסוחרים יוכלו לעיין בו ולאמת את פעולתו. כל הכבוד למחבר! אמנם ניתן להשתמש בו בחינם, אך זכור כי פרסום חוזר של הקוד כפוף ל־כללי הבית שלנו.

כתב ויתור
המידע והפרסומים אינם מיועדים להיות, ואינם מהווים, ייעוץ או המלצה פיננסית, השקעתית, מסחרית או מכל סוג אחר המסופקת או מאושרת על ידי TradingView. קרא עוד ב־תנאי השימוש.
סקריפט קוד פתוח
ברוח האמיתית של TradingView, יוצר הסקריפט הזה הפך אותו לקוד פתוח, כך שסוחרים יוכלו לעיין בו ולאמת את פעולתו. כל הכבוד למחבר! אמנם ניתן להשתמש בו בחינם, אך זכור כי פרסום חוזר של הקוד כפוף ל־כללי הבית שלנו.
כתב ויתור
המידע והפרסומים אינם מיועדים להיות, ואינם מהווים, ייעוץ או המלצה פיננסית, השקעתית, מסחרית או מכל סוג אחר המסופקת או מאושרת על ידי TradingView. קרא עוד ב־תנאי השימוש.