Rolling Volume Profile(s)
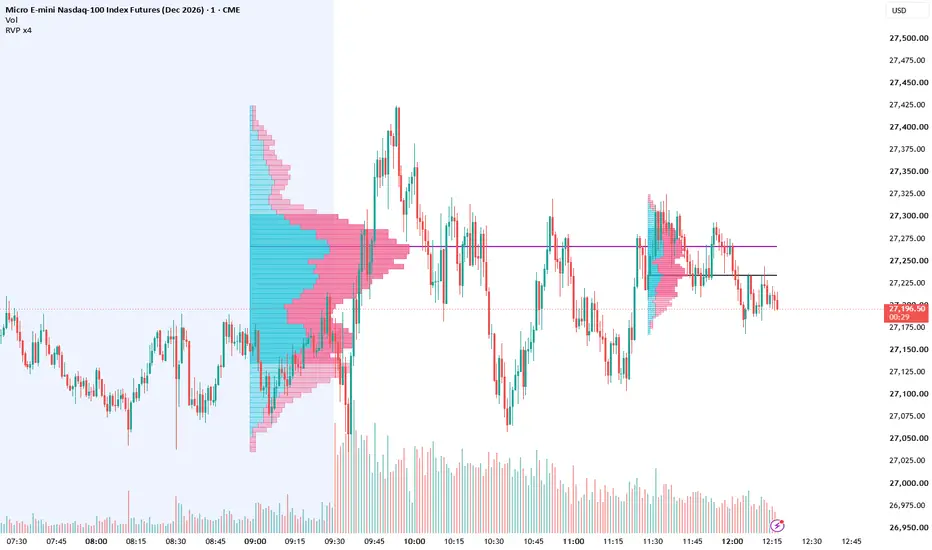
ROLLING VOLUME PROFILE x4
WHAT IT IS
A volume profile that moves with the chart. Up to four profiles can be shown at once, each built from the last N candles you choose (for example 100, 200, 300 and 500). Each profile always ends on the current candle, so it shows where volume has traded over a recent, fixed number of candles rather than a fixed session or a range you draw by hand.
WHAT IT DOES
- Draws a volume histogram (Up/Down, Total, or Delta) for each active profile.
- Marks each profile's Point of Control (POC), with its own color per profile.
- Optionally shows the Value Area High (VAH) and Value Area Low (VAL).
- Optionally plots the Developing POC and Developing Value Area, showing how those levels moved candle by candle.
- Shows the current POC, VAH and VAL of every profile in the Data Window.
HOW IT WORKS
- Window: each profile covers the last N candles, including the current one. When a new candle opens, the oldest candle drops out. The current candle is recalculated on every tick.
- Volume distribution: each candle's volume is spread evenly across its high-low range and divided among the price rows it touches. A candle counts as Up volume when close >= open, and Down volume when close < open.
- POC: the row with the highest total volume.
- Value Area: starting at the POC, rows are added one at a time (whichever neighbor, above or below, has more volume) until the Value Area percentage of total volume is reached.
- Settings follow TradingView's Fixed Range Volume Profile. FRVP uses lower-timeframe data, while this script uses the chart's own candles, so row values will be close to FRVP but not identical.
- Row limit: TradingView allows 500 boxes per indicator, shared by all profiles. Each row uses up to 2 boxes, so the maximum rows per profile drop automatically as more profiles are turned on: about 240 rows with 1 profile, 125 with 2, 83 with 3 and 62 with 4.
SETTINGS
Profiles
- Profile 1-4: turn each profile on or off, set its number of candles (2-5000), and choose its POC color.
Inputs (apply to all profiles)
- Rows Layout: "Number of Rows" sets a fixed row count; "Ticks Per Row" sets a fixed row height in ticks.
- Row Size: the number of rows or the ticks per row, depending on Rows Layout. Reduced automatically when needed to stay under the 500-box limit.
- Volume: Up/Down (two-color bars), Total (one bar), or Delta (Up minus Down, colored by the larger side).
- Value Area Volume: the percentage of total volume inside the Value Area (default 70).
- Extend Right: extends the POC, VAH and VAL lines to the right edge of the chart.
Style
- Volume profile: show or hide the histogram.
- Values: show the volume number at the end of each row, with your choice of color.
- Width (% of the box): how far the longest row reaches across the profile's candle range.
- Placement: anchor the histogram to the Left or Right side of the window.
- Up Volume / Down Volume / Value Area Up / Value Area Down: row colors inside and outside the Value Area.
- VAH / VAL: show the lines and set color, width and style (Solid, Dashed, Dotted).
- POC: show the line and set width and style (the color is set per profile).
- Developing POC: plots each profile's POC as it moved, in that profile's POC color.
- Developing VA: plots the developing VAH and VAL, with your choice of color.
- Developing lines: candles back: how far back the developing lines are drawn. Higher values take longer to load.
- Histogram Box: draws a shaded box around each profile's full price range and candle window.
TIPS
- Use different candle counts to compare short-term and longer-term volume areas, for example where a short-term POC sits against a longer-term POC.
- With 3 or 4 profiles on, give each POC a distinct color so the lines are easy to tell apart.
- If loading feels slow, reduce "Developing lines: candles back" or turn the developing lines off.
WHAT IT IS
A volume profile that moves with the chart. Up to four profiles can be shown at once, each built from the last N candles you choose (for example 100, 200, 300 and 500). Each profile always ends on the current candle, so it shows where volume has traded over a recent, fixed number of candles rather than a fixed session or a range you draw by hand.
WHAT IT DOES
- Draws a volume histogram (Up/Down, Total, or Delta) for each active profile.
- Marks each profile's Point of Control (POC), with its own color per profile.
- Optionally shows the Value Area High (VAH) and Value Area Low (VAL).
- Optionally plots the Developing POC and Developing Value Area, showing how those levels moved candle by candle.
- Shows the current POC, VAH and VAL of every profile in the Data Window.
HOW IT WORKS
- Window: each profile covers the last N candles, including the current one. When a new candle opens, the oldest candle drops out. The current candle is recalculated on every tick.
- Volume distribution: each candle's volume is spread evenly across its high-low range and divided among the price rows it touches. A candle counts as Up volume when close >= open, and Down volume when close < open.
- POC: the row with the highest total volume.
- Value Area: starting at the POC, rows are added one at a time (whichever neighbor, above or below, has more volume) until the Value Area percentage of total volume is reached.
- Settings follow TradingView's Fixed Range Volume Profile. FRVP uses lower-timeframe data, while this script uses the chart's own candles, so row values will be close to FRVP but not identical.
- Row limit: TradingView allows 500 boxes per indicator, shared by all profiles. Each row uses up to 2 boxes, so the maximum rows per profile drop automatically as more profiles are turned on: about 240 rows with 1 profile, 125 with 2, 83 with 3 and 62 with 4.
SETTINGS
Profiles
- Profile 1-4: turn each profile on or off, set its number of candles (2-5000), and choose its POC color.
Inputs (apply to all profiles)
- Rows Layout: "Number of Rows" sets a fixed row count; "Ticks Per Row" sets a fixed row height in ticks.
- Row Size: the number of rows or the ticks per row, depending on Rows Layout. Reduced automatically when needed to stay under the 500-box limit.
- Volume: Up/Down (two-color bars), Total (one bar), or Delta (Up minus Down, colored by the larger side).
- Value Area Volume: the percentage of total volume inside the Value Area (default 70).
- Extend Right: extends the POC, VAH and VAL lines to the right edge of the chart.
Style
- Volume profile: show or hide the histogram.
- Values: show the volume number at the end of each row, with your choice of color.
- Width (% of the box): how far the longest row reaches across the profile's candle range.
- Placement: anchor the histogram to the Left or Right side of the window.
- Up Volume / Down Volume / Value Area Up / Value Area Down: row colors inside and outside the Value Area.
- VAH / VAL: show the lines and set color, width and style (Solid, Dashed, Dotted).
- POC: show the line and set width and style (the color is set per profile).
- Developing POC: plots each profile's POC as it moved, in that profile's POC color.
- Developing VA: plots the developing VAH and VAL, with your choice of color.
- Developing lines: candles back: how far back the developing lines are drawn. Higher values take longer to load.
- Histogram Box: draws a shaded box around each profile's full price range and candle window.
TIPS
- Use different candle counts to compare short-term and longer-term volume areas, for example where a short-term POC sits against a longer-term POC.
- With 3 or 4 profiles on, give each POC a distinct color so the lines are easy to tell apart.
- If loading feels slow, reduce "Developing lines: candles back" or turn the developing lines off.

כתב ויתור
המידע והפרסומים אינם מיועדים להיות, ואינם מהווים, ייעוץ או המלצה פיננסית, השקעתית, מסחרית או מכל סוג אחר המסופקת או מאושרת על ידי TradingView. קרא עוד ב־תנאי השימוש.
כתב ויתור
המידע והפרסומים אינם מיועדים להיות, ואינם מהווים, ייעוץ או המלצה פיננסית, השקעתית, מסחרית או מכל סוג אחר המסופקת או מאושרת על ידי TradingView. קרא עוד ב־תנאי השימוש.