Quanty | Cross-Exchange Volume
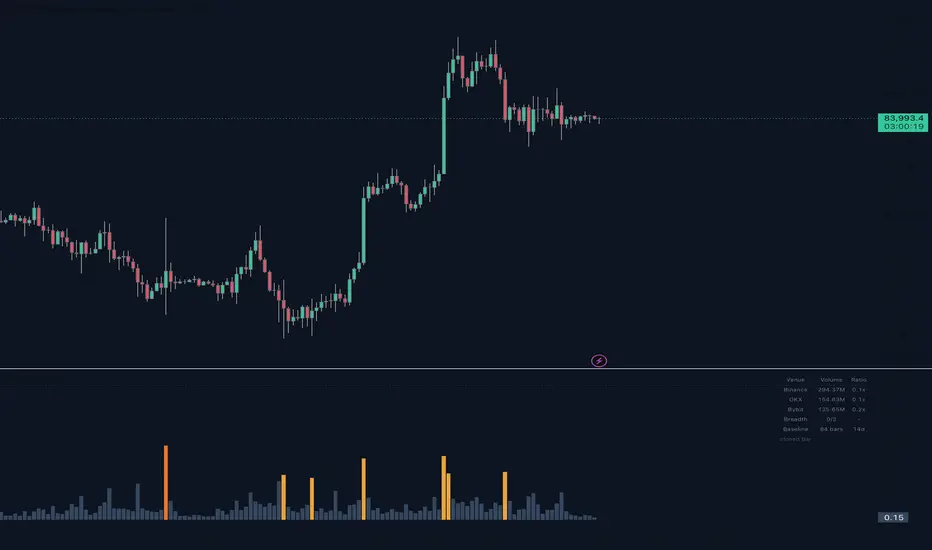
Most volume indicators read one exchange. For a crypto perpetual that is only part of the flow: the same candle can look ordinary on the venue you happen to be charting and extreme once every venue is counted. This script aggregates perpetual volume across Binance, OKX and Bybit and measures the current candle against its own recent baseline.
HOW IT IS CALCULATED
Each venue's volume is converted to quote currency and summed. That aggregate is divided by its own average over the previous N days of the chart timeframe.
The current candle is excluded from its own baseline, so a large candle cannot lift the average it is being compared against.
The baseline window follows the chart timeframe, so 14 days means 84 bars on a 4-hour chart and 14 bars on a daily chart. On very low timeframes the window is capped at 2000 bars. The panel reports the window actually used, so a reading is never quietly based on less history than the setting implies.
READING IT
The histogram is the ratio, not raw volume, so it is scale-free: a large-cap and a newly listed asset can be read on the same axis. Dotted lines mark the three intensity thresholds.
The panel shows each venue's raw volume and its own ratio, then a breadth line. Breadth is the part a single-exchange tool cannot give you. A spike confirmed on every venue is market-wide participation. A spike on one venue while the others sit near 1x is venue-specific, and deserves more scepticism: a listing, an incentive programme, or a single participant will all look identical to a volume reading taken from that one venue.
A WORD ON VOLUME UNITS
Venues do not agree on what the volume field contains. Binance and Bybit perpetual volume arrives in the base asset; OKX perpetual volume arrives already in quote currency. Multiplying an already-quoted figure by price counts the price twice and inflates that venue by roughly the asset price. On a BTC candle this produced 12,985B for OKX against 294M for Binance before it was corrected.
Each venue therefore has a quote switch, set correctly by default. The Volume column shows raw figures rather than percentages precisely so that a mismatch is visible: every venue should land in the same order of magnitude. A percentage would normalise the error and hide it.
NOTES AND LIMITATIONS
Volume is not direction. Unusual volume precedes falls as often as rises. This measures participation, not intent, and no threshold here is a signal to buy or sell.
Readings are taken on closed candles by default. The panel always reports the last closed bar, because on a forming candle the charted venue updates tick by tick while requested venues lag, which distorts every share.
The symbol suffix must match the instrument: USDT.P for perpetuals, USDT for spot. Venues where the asset is not listed are left out of the sum rather than counted as zero, and if no venue resolves the panel says so instead of showing a blank reading.
Venue prefixes are inputs. A wrong one fails quietly by contributing less volume, so check the Volume column before trusting the numbers.
HOW IT IS CALCULATED
Each venue's volume is converted to quote currency and summed. That aggregate is divided by its own average over the previous N days of the chart timeframe.
The current candle is excluded from its own baseline, so a large candle cannot lift the average it is being compared against.
The baseline window follows the chart timeframe, so 14 days means 84 bars on a 4-hour chart and 14 bars on a daily chart. On very low timeframes the window is capped at 2000 bars. The panel reports the window actually used, so a reading is never quietly based on less history than the setting implies.
READING IT
The histogram is the ratio, not raw volume, so it is scale-free: a large-cap and a newly listed asset can be read on the same axis. Dotted lines mark the three intensity thresholds.
The panel shows each venue's raw volume and its own ratio, then a breadth line. Breadth is the part a single-exchange tool cannot give you. A spike confirmed on every venue is market-wide participation. A spike on one venue while the others sit near 1x is venue-specific, and deserves more scepticism: a listing, an incentive programme, or a single participant will all look identical to a volume reading taken from that one venue.
A WORD ON VOLUME UNITS
Venues do not agree on what the volume field contains. Binance and Bybit perpetual volume arrives in the base asset; OKX perpetual volume arrives already in quote currency. Multiplying an already-quoted figure by price counts the price twice and inflates that venue by roughly the asset price. On a BTC candle this produced 12,985B for OKX against 294M for Binance before it was corrected.
Each venue therefore has a quote switch, set correctly by default. The Volume column shows raw figures rather than percentages precisely so that a mismatch is visible: every venue should land in the same order of magnitude. A percentage would normalise the error and hide it.
NOTES AND LIMITATIONS
Volume is not direction. Unusual volume precedes falls as often as rises. This measures participation, not intent, and no threshold here is a signal to buy or sell.
Readings are taken on closed candles by default. The panel always reports the last closed bar, because on a forming candle the charted venue updates tick by tick while requested venues lag, which distorts every share.
The symbol suffix must match the instrument: USDT.P for perpetuals, USDT for spot. Venues where the asset is not listed are left out of the sum rather than counted as zero, and if no venue resolves the panel says so instead of showing a blank reading.
Venue prefixes are inputs. A wrong one fails quietly by contributing less volume, so check the Volume column before trusting the numbers.

כתב ויתור
המידע והפרסומים אינם מיועדים להיות, ואינם מהווים, ייעוץ או המלצה פיננסית, השקעתית, מסחרית או מכל סוג אחר המסופקת או מאושרת על ידי TradingView. קרא עוד ב־תנאי השימוש.
כתב ויתור
המידע והפרסומים אינם מיועדים להיות, ואינם מהווים, ייעוץ או המלצה פיננסית, השקעתית, מסחרית או מכל סוג אחר המסופקת או מאושרת על ידי TradingView. קרא עוד ב־תנאי השימוש.