Candle Breakouts [SMRT Algo]
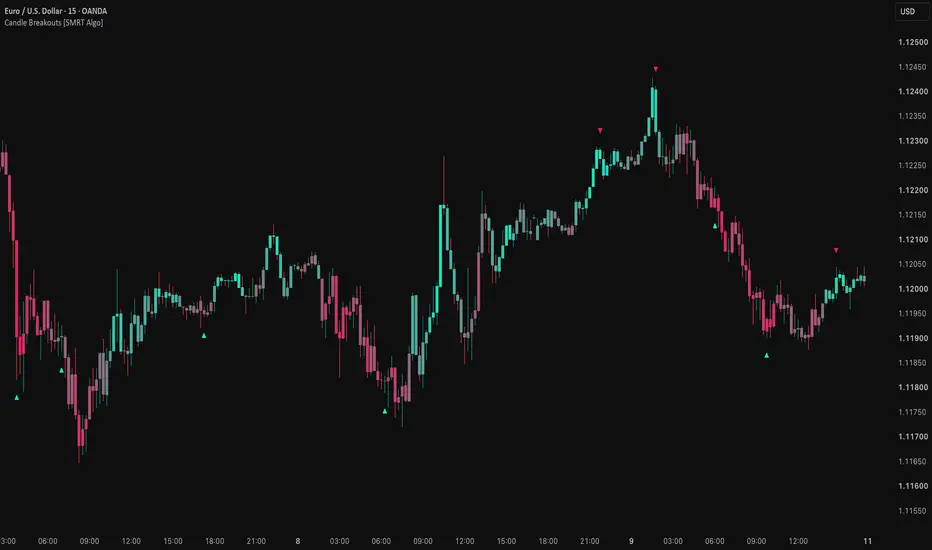
Candle Breakouts [SMRT Algo] brings price-sequence analysis and momentum visualization directly onto your chart. It marks completed sequences of closing-price comparisons and uses a smooth candle-color gradient to show the direction and relative strength of recent momentum.
Sequence markers highlight discrete events, while the gradient provides continuous context between them. Together, they help users study how sustained price movement develops and how momentum behaves around each completed sequence.
Key Features

How It Works
1. Closing-Price Sequences
On each bar, the indicator compares the current close with the close four bars earlier and updates two separate counts:
A count resets to zero when its condition fails, including when the two closes are equal. After reaching the threshold, the next qualifying bar starts a new count at one. This allows repeated markers during a sustained move.
These sequences do not require every candle to close above or below the immediately preceding candle. Each comparison uses the close four bars earlier.
Default example: The visible threshold is 75% of Candle Offset, rounded to the nearest integer. A Candle Offset of 10 therefore produces a marker after 8 consecutive qualifying comparisons. The four-bar reference remains fixed.
2. Momentum-Based Candle Colors
The indicator measures the change between the current close and the close Gradient Length bars earlier. It normalizes that change against the largest absolute momentum reading over the same lookback window, then smooths the result with an EMA.
As the smoothed value moves farther from zero, the gradient moves toward the corresponding bullish or bearish color. Its intensity describes momentum relative to recent readings; it does not measure volume, signal accuracy, or the probability of a profitable trade. Colors can differ from a candle's open-to-close direction.
Reading the Annotated Example
The chart illustrates three important relationships:
An upward marker can appear while momentum remains negative, and a downward marker can appear while momentum remains positive. The combination allows users to examine a completed sequence alongside its momentum context without treating either display as confirmation of the other.
Settings Guide
Usage and Limitations
Use the indicator to study sustained closing-price sequences and changes in momentum alongside your own chart analysis. Support and resistance, market structure, and other context must be assessed separately; the script does not calculate them.
Despite the Candle Breakouts name, this version does not test whether price has crossed a support, resistance, or range boundary. Its triangles mark sequence completion and should not be treated as confirmed breakouts, confirmed reversals, or automatic trade entries.
Calculations use the current chart's timeframe. The script uses no future-bar references, higher-timeframe requests, or backward-shifted plots. However, the open candle's changing close can cause its marker or color to change or disappear before the bar closes. Assess completed-bar signals after the close.
The current version displays standard ▲ and ▼ markers only. It contains no built-in alert conditions, automated orders, stop-loss or take-profit levels, or strategy backtest.
For educational and informational purposes only. Sequence completion and momentum readings do not guarantee future price direction or trading results.
Sequence markers highlight discrete events, while the gradient provides continuous context between them. Together, they help users study how sustained price movement develops and how momentum behaves around each completed sequence.
Key Features
- Price-Sequence Markers: Teal ▲ and pink ▼ markers identify completed sequences based on a fixed four-bar closing-price comparison.
- Adjustable Sequence Length: Candle Offset controls the threshold used for visible markers.
- Momentum Gradient: Candle colors transition between bearish, neutral, and bullish shades according to normalized price momentum.
- EMA Smoothing: Adjustable smoothing makes color transitions more gradual.
- Independent Displays: Bar coloring can be disabled without removing sequence markers. Momentum color does not filter marker generation.
- Customizable Palette: Bullish, bearish, and neutral colors can be adapted to your chart theme.
How It Works
1. Closing-Price Sequences
On each bar, the indicator compares the current close with the close four bars earlier and updates two separate counts:
- Below-reference sequence → teal ▲: Each consecutive close below its own four-bars-earlier close advances the count. When the threshold is reached, a teal upward marker appears below the candle.
- Above-reference sequence → pink ▼: Each consecutive close above its own four-bars-earlier close advances the count. When the threshold is reached, a pink downward marker appears above the candle.
A count resets to zero when its condition fails, including when the two closes are equal. After reaching the threshold, the next qualifying bar starts a new count at one. This allows repeated markers during a sustained move.
These sequences do not require every candle to close above or below the immediately preceding candle. Each comparison uses the close four bars earlier.
Default example: The visible threshold is 75% of Candle Offset, rounded to the nearest integer. A Candle Offset of 10 therefore produces a marker after 8 consecutive qualifying comparisons. The four-bar reference remains fixed.
2. Momentum-Based Candle Colors
The indicator measures the change between the current close and the close Gradient Length bars earlier. It normalizes that change against the largest absolute momentum reading over the same lookback window, then smooths the result with an EMA.
- Teal: Positive smoothed normalized momentum.
- Pink: Negative smoothed normalized momentum.
- Gray: Smoothed normalized momentum near zero.
As the smoothed value moves farther from zero, the gradient moves toward the corresponding bullish or bearish color. Its intensity describes momentum relative to recent readings; it does not measure volume, signal accuracy, or the probability of a profitable trade. Colors can differ from a candle's open-to-close direction.
Reading the Annotated Example
The chart illustrates three important relationships:
- The pink marker identifies a completed above-reference sequence.
- The teal markers during the decline show that sequence completion can be followed by further falling prices.
- The teal candle colors on the right show positive smoothed momentum, independently of the marker calculation.
An upward marker can appear while momentum remains negative, and a downward marker can appear while momentum remains positive. The combination allows users to examine a completed sequence alongside its momentum context without treating either display as confirmation of the other.
Settings Guide
- Candle Offset — default 10, minimum 4: Sets the base value from which the visible sequence threshold is calculated. Higher values require longer qualifying sequences. Because the threshold is rounded, some adjacent values produce the same result. This setting neither changes the four-bar reference nor shifts markers on the chart.
- Enable Bar Colors — default on: Shows or hides the momentum gradient while retaining markers.
- Gradient Length — default 10: Sets both the price-change lookback and the normalization window. It does not affect sequence counting.
- Gradient Smoothing — default 3: Sets the EMA smoothing length. Higher values generally produce smoother, slower color transitions.
- Bearish / Neutral / Bullish Colors: Set the gradient palette. Bearish and bullish colors also control the corresponding triangle markers.
Usage and Limitations
Use the indicator to study sustained closing-price sequences and changes in momentum alongside your own chart analysis. Support and resistance, market structure, and other context must be assessed separately; the script does not calculate them.
Despite the Candle Breakouts name, this version does not test whether price has crossed a support, resistance, or range boundary. Its triangles mark sequence completion and should not be treated as confirmed breakouts, confirmed reversals, or automatic trade entries.
Calculations use the current chart's timeframe. The script uses no future-bar references, higher-timeframe requests, or backward-shifted plots. However, the open candle's changing close can cause its marker or color to change or disappear before the bar closes. Assess completed-bar signals after the close.
The current version displays standard ▲ and ▼ markers only. It contains no built-in alert conditions, automated orders, stop-loss or take-profit levels, or strategy backtest.
For educational and informational purposes only. Sequence completion and momentum readings do not guarantee future price direction or trading results.

Get access: smrtalgo.com
Join our Discord: discord.com/invite/f7gVrMPkaC
All content provided by SMRT Algo is for informational & educational purposes only. Past performance does not guarantee future results.
Join our Discord: discord.com/invite/f7gVrMPkaC
All content provided by SMRT Algo is for informational & educational purposes only. Past performance does not guarantee future results.
כתב ויתור
המידע והפרסומים אינם מיועדים להיות, ואינם מהווים, ייעוץ או המלצה פיננסית, השקעתית, מסחרית או מכל סוג אחר המסופקת או מאושרת על ידי TradingView. קרא עוד ב־תנאי השימוש.
Get access: smrtalgo.com
Join our Discord: discord.com/invite/f7gVrMPkaC
All content provided by SMRT Algo is for informational & educational purposes only. Past performance does not guarantee future results.
Join our Discord: discord.com/invite/f7gVrMPkaC
All content provided by SMRT Algo is for informational & educational purposes only. Past performance does not guarantee future results.
כתב ויתור
המידע והפרסומים אינם מיועדים להיות, ואינם מהווים, ייעוץ או המלצה פיננסית, השקעתית, מסחרית או מכל סוג אחר המסופקת או מאושרת על ידי TradingView. קרא עוד ב־תנאי השימוש.