OPEN-SOURCE SCRIPT
Z-Score Oscillator
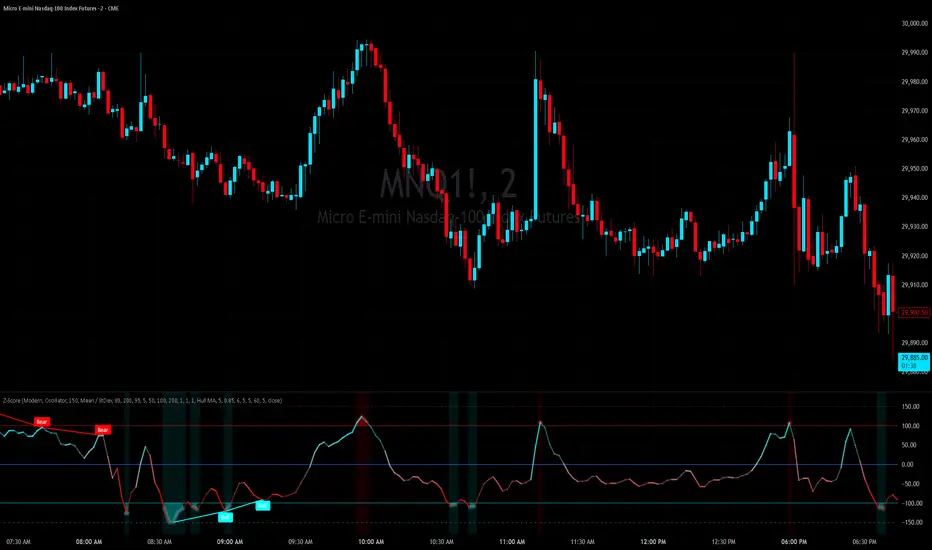
Z-Score Oscillator is a statistical momentum tool that measures how far the current price is from its rolling mean in standard-deviation units, then optionally normalizes that measurement into a fixed-range oscillator for clean overbought/oversold reading. It combines classical statistical rigor with modern enhancements — robust calculation methods, multi-period adaptive thresholds, low-lag smoothing, and built-in divergence detection — into a single configurable indicator.
── What It Measures ──
The core calculation is the z-score: the number of standard deviations the current source value sits above or below its rolling mean. A z-score of +2 means price is two standard deviations above its average; -2 means two below. This converts raw price action into a statistically grounded measure of extremity that adapts automatically to changing volatility regimes.
Unlike traditional oscillators with arbitrary fixed scales (RSI 0–100, Stochastic 0–100), z-score is grounded in the actual statistical distribution of the data. A reading of +2.5 has the same statistical meaning across any asset, timeframe, or volatility environment.
── What It's For ──
══════════════ FEATURES ══════════════
── Three Display Modes ──
Oscillator Mode (default) — Normalizes the z-score into a fixed-scale oscillator where the upper and lower percentile thresholds map to +100 and -100 respectively. Provides familiar overbought/oversold semantics with consistent visual scale regardless of volatility regime.
Z-Score Mode — Classic floating z-score display with dynamic percentile threshold lines that adapt to the current distribution. Best for users who want to see raw statistical extremity values.
Percentile Rank Mode — Plots the rank of the current z-score within the lookback window, centered on zero. Range spans roughly ±50, with bands marking the configured percentile cutoffs. Distribution-free; ideal for non-Gaussian data.

── Calculation Methods ──
Mean / StDev (classic) — Standard z-score using rolling arithmetic mean and standard deviation. Statistically conventional but sensitive to outliers — a single price spike can inflate the standard deviation and suppress future readings.
Median / MAD (robust) — Robust z-score using the rolling median and median absolute deviation (scaled by 1.4826 for Gaussian consistency). Outlier-resistant and dramatically more stable on instruments prone to wicks, gaps, or volume spikes. Recommended for crypto, futures, and any data with non-Gaussian tails.
── Smoothing System ──
Five smoothing algorithms available, applied to the raw z-score before normalization so both Oscillator and Z-Score modes inherit the smoothed series cleanly:
Default is Hull MA at length 5 — fast, low-lag, and effective for reducing bar-to-bar jitter without dampening genuine moves.
── Multi-Period Percentile Blend ──
Rather than relying on a single lookback window to define overbought/oversold thresholds, the indicator can blend percentile calculations across three configurable periods (default 50/100/200 bars, equally weighted). This creates more stable, regime-aware threshold levels:
Each period's weight is user-adjustable and auto-normalized. Set any weight to zero to exclude that period from the blend. Enabled by default for more sophisticated threshold behavior out of the box.
── Divergence Detection ──
Detects four types of divergence between price and the displayed oscillator value:
Pivot detection uses configurable left/right lookback bars with a range filter for the distance between pivots. Optional repaint-prevention mode delays plotting until the candle closes. Divergence detection runs against the active display mode, so divergences are detected against the same series being shown to the user.
The divergence detection logic is based on the open-source Divergence Indicator (any oscillator) by yatrader2, adapted to v6 and integrated into the unified plotting and theming system.
── Theme & Visual System ──
Six color themes — Modern (default cyan/red), Classic (green/red), Neon (high-contrast green/magenta), Monochrome (grayscale), Sunset (warm orange/coral), Ocean (full-blue palette). The theme applies to every visual element: line color, zone fills, threshold lines, divergence labels, glow, and background tint.
Gradient line coloring — Optional smooth color transition through the theme palette based on position within the threshold range, replacing binary sign-based coloring.
Glow effect on extremes — Multi-layer concentric halo around the main line when in overbought/oversold territory, drawing attention to actionable moments.
Background tint — Optional pane-wide background wash when in extreme zones, matching the OB/OS fill color.
OB/OS color fill — Toggleable fill between the main line and the upper/lower bands when in extreme territory.
══════════════ ATTRIBUTION ══════════════
Divergence detection adapted from the open-source Divergence Indicator (any oscillator) by yatrader2.
── What It Measures ──
The core calculation is the z-score: the number of standard deviations the current source value sits above or below its rolling mean. A z-score of +2 means price is two standard deviations above its average; -2 means two below. This converts raw price action into a statistically grounded measure of extremity that adapts automatically to changing volatility regimes.
Unlike traditional oscillators with arbitrary fixed scales (RSI 0–100, Stochastic 0–100), z-score is grounded in the actual statistical distribution of the data. A reading of +2.5 has the same statistical meaning across any asset, timeframe, or volatility environment.
── What It's For ──
- Identifying statistical extremes for mean-reversion setups
- Confirming trend strength via persistent z-score elevation
- Spotting divergences between price and underlying momentum
- Cross-asset and cross-timeframe comparison on a normalized scale
- Filtering signals from other indicators based on statistical context
══════════════ FEATURES ══════════════
── Three Display Modes ──
Oscillator Mode (default) — Normalizes the z-score into a fixed-scale oscillator where the upper and lower percentile thresholds map to +100 and -100 respectively. Provides familiar overbought/oversold semantics with consistent visual scale regardless of volatility regime.
Z-Score Mode — Classic floating z-score display with dynamic percentile threshold lines that adapt to the current distribution. Best for users who want to see raw statistical extremity values.
Percentile Rank Mode — Plots the rank of the current z-score within the lookback window, centered on zero. Range spans roughly ±50, with bands marking the configured percentile cutoffs. Distribution-free; ideal for non-Gaussian data.
── Calculation Methods ──
Mean / StDev (classic) — Standard z-score using rolling arithmetic mean and standard deviation. Statistically conventional but sensitive to outliers — a single price spike can inflate the standard deviation and suppress future readings.
Median / MAD (robust) — Robust z-score using the rolling median and median absolute deviation (scaled by 1.4826 for Gaussian consistency). Outlier-resistant and dramatically more stable on instruments prone to wicks, gaps, or volume spikes. Recommended for crypto, futures, and any data with non-Gaussian tails.
── Smoothing System ──
Five smoothing algorithms available, applied to the raw z-score before normalization so both Oscillator and Z-Score modes inherit the smoothed series cleanly:
- ALMA — Gaussian-weighted moving average with configurable offset and sigma
- LinReg — Linear regression endpoint
- Hull MA — Low-lag weighted moving average (default)
- Super Smoother — Ehlers 2-pole Butterworth filter
- Two-Pole Gaussian — Ehlers Gaussian filter with minimal phase distortion
Default is Hull MA at length 5 — fast, low-lag, and effective for reducing bar-to-bar jitter without dampening genuine moves.
── Multi-Period Percentile Blend ──
Rather than relying on a single lookback window to define overbought/oversold thresholds, the indicator can blend percentile calculations across three configurable periods (default 50/100/200 bars, equally weighted). This creates more stable, regime-aware threshold levels:
- Short period reacts quickly to recent volatility shifts
- Medium period provides intermediate context
- Long period anchors the thresholds against deeper history
Each period's weight is user-adjustable and auto-normalized. Set any weight to zero to exclude that period from the blend. Enabled by default for more sophisticated threshold behavior out of the box.
── Divergence Detection ──
Detects four types of divergence between price and the displayed oscillator value:
- Regular Bullish — Price makes a lower low while oscillator makes a higher low (potential reversal up)
- Regular Bearish — Price makes a higher high while oscillator makes a lower high (potential reversal down)
- Hidden Bullish — Price makes a higher low while oscillator makes a lower low (trend continuation up)
- Hidden Bearish — Price makes a lower high while oscillator makes a higher high (trend continuation down)
Pivot detection uses configurable left/right lookback bars with a range filter for the distance between pivots. Optional repaint-prevention mode delays plotting until the candle closes. Divergence detection runs against the active display mode, so divergences are detected against the same series being shown to the user.
The divergence detection logic is based on the open-source Divergence Indicator (any oscillator) by yatrader2, adapted to v6 and integrated into the unified plotting and theming system.
── Theme & Visual System ──
Six color themes — Modern (default cyan/red), Classic (green/red), Neon (high-contrast green/magenta), Monochrome (grayscale), Sunset (warm orange/coral), Ocean (full-blue palette). The theme applies to every visual element: line color, zone fills, threshold lines, divergence labels, glow, and background tint.
Gradient line coloring — Optional smooth color transition through the theme palette based on position within the threshold range, replacing binary sign-based coloring.
Glow effect on extremes — Multi-layer concentric halo around the main line when in overbought/oversold territory, drawing attention to actionable moments.
Background tint — Optional pane-wide background wash when in extreme zones, matching the OB/OS fill color.
OB/OS color fill — Toggleable fill between the main line and the upper/lower bands when in extreme territory.
══════════════ ATTRIBUTION ══════════════
Divergence detection adapted from the open-source Divergence Indicator (any oscillator) by yatrader2.
סקריפט קוד פתוח
ברוח האמיתית של TradingView, יוצר הסקריפט הזה הפך אותו לקוד פתוח, כך שסוחרים יוכלו לעיין בו ולאמת את פעולתו. כל הכבוד למחבר! אמנם ניתן להשתמש בו בחינם, אך זכור כי פרסום חוזר של הקוד כפוף ל־כללי הבית שלנו.

discord.gg/REapC6SGtz
b3artrades@gmail.com
b3artrades@gmail.com
כתב ויתור
המידע והפרסומים אינם מיועדים להיות, ואינם מהווים, ייעוץ או המלצה פיננסית, השקעתית, מסחרית או מכל סוג אחר המסופקת או מאושרת על ידי TradingView. קרא עוד ב־תנאי השימוש.
סקריפט קוד פתוח
ברוח האמיתית של TradingView, יוצר הסקריפט הזה הפך אותו לקוד פתוח, כך שסוחרים יוכלו לעיין בו ולאמת את פעולתו. כל הכבוד למחבר! אמנם ניתן להשתמש בו בחינם, אך זכור כי פרסום חוזר של הקוד כפוף ל־כללי הבית שלנו.
discord.gg/REapC6SGtz
b3artrades@gmail.com
b3artrades@gmail.com
כתב ויתור
המידע והפרסומים אינם מיועדים להיות, ואינם מהווים, ייעוץ או המלצה פיננסית, השקעתית, מסחרית או מכל סוג אחר המסופקת או מאושרת על ידי TradingView. קרא עוד ב־תנאי השימוש.