OPEN-SOURCE SCRIPT
Geometry | Manifold Learning
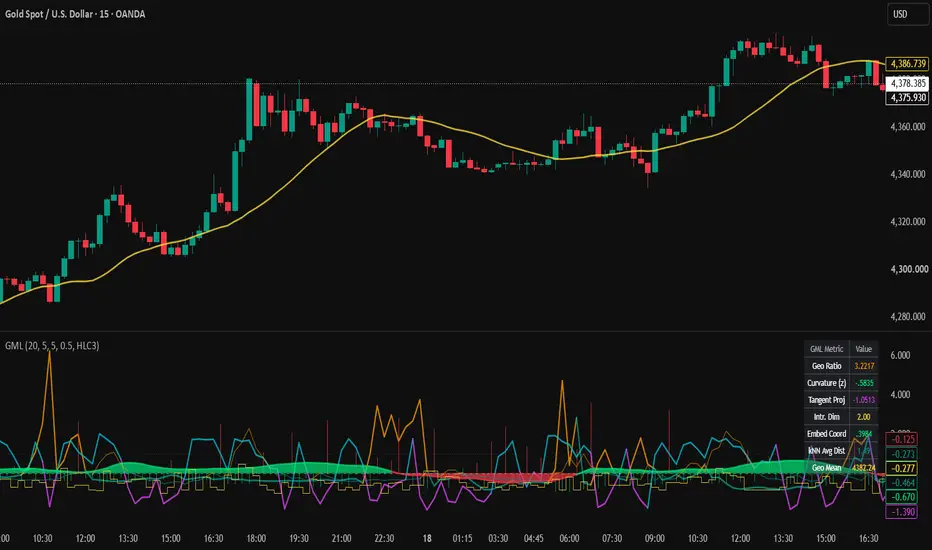
Geometry | Manifold Learning (GML) is an experimental market-structure indicator that analyzes price movement from a geometric perspective.
Traditional technical indicators often reduce market behavior to trend, momentum, volatility, or moving averages. GML takes a different approach: it treats recent price observations as points belonging to a locally evolving geometric structure, or "manifold."
The objective is not to predict future prices. Instead, the indicator attempts to describe the current structure of price movement by measuring:
• Geodesic path behavior
• Local price curvature
• Tangent projection
• Local neighborhood density using k-nearest-neighbor concepts
• Intrinsic dimensionality
• Normalized embedding direction
• Local geometric mean
These measurements are combined into a multi-component oscillator designed to help traders study whether recent price action is relatively directional, compressed, dispersed, curved, or undergoing a structural transition.
Core Concept
Financial prices do not always move efficiently from one level to another.
For example, price may begin at 100 and end at 105.
The direct displacement is only 5 points, but the actual path could have travelled:
100 → 103 → 101 → 106 → 102 → 105
The total distance travelled is substantially greater than the final displacement.
GML uses this distinction between direct displacement and travelled path as one way of describing the geometry of recent price action.
A relatively direct path may indicate more organized directional movement, while a large travelled path relative to displacement can indicate a more complex or inefficient local structure.
This concept forms the foundation of the indicator's Geodesic Ratio.
1. Geodesic Ratio
The indicator calculates two distances over the selected embedding window.
Euclidean Distance:
The absolute difference between the current price and the price at the opposite end of the observation window.
Geodesic Distance:
The cumulative absolute movement between consecutive observations within the same window.
The ratio is then calculated conceptually as:
Geodesic Ratio = Travelled Path / Direct Displacement
A larger ratio means price travelled a relatively complicated path to reach its current location.
A smaller ratio represents a more direct path.
The ratio is normalized using its historical mean and standard deviation to produce the displayed Geodesic Ratio Z-score.
Interpretation
Positive/high readings can indicate that the recent path is relatively complex or indirect.
Negative/low readings indicate that the path is relatively more linear compared with its recent behavior.
This measurement should not independently be interpreted as bullish or bearish. It describes the geometry of the path rather than its direction.
2. Local Curvature
GML estimates local curvature using first- and second-order changes in price.
The first difference measures local price movement, while the second difference measures how rapidly that movement itself is changing.
Conceptually, high curvature represents a sharper local bend in the price path.
The raw curvature measurement is normalized into a Z-score relative to its recent history.
Interpretation
Higher positive Curvature Z-scores indicate that the current local bend is unusually large compared with recent observations.
Lower readings indicate a relatively smoother local trajectory.
High curvature does NOT automatically indicate a market reversal.
It simply identifies an area where the local geometry of price has changed more sharply than normal.
The Curvature Threshold input controls how unusual curvature must become before it qualifies as a high-curvature condition within the signal logic.
3. Tangent Projection
The Tangent Projection measures the position of current price relative to a locally smoothed price structure.
The script calculates a local mean and standard deviation over the selected smoothing period and normalizes the current deviation from that local mean.
This creates a standardized representation of where price currently sits relative to its recent local structure.
General interpretation
Above zero:
Price is positioned above its local mean.
Below zero:
Price is positioned below its local mean.
Movement toward zero:
Price is returning toward its local center.
Movement away from zero:
Price is extending farther away from the local center.
The reversal logic additionally examines whether a negative tangent projection has begun recovering.
4. k-Nearest-Neighborhood Distance
The indicator compares the current price with observations inside the selected embedding window and identifies nearby observations based on absolute price distance.
The average distance of the nearest observations provides a local neighborhood-radius estimate.
This value is then normalized relative to its recent history.
Interpretation
Negative kNN Z-score:
The local neighborhood is relatively tight compared with recent conditions.
Positive kNN Z-score:
The local neighborhood is relatively dispersed.
This can be thought of as a geometric measure of local price concentration rather than a conventional volatility indicator.
The signal engine uses this information to distinguish between tighter and looser local structures.
5. Intrinsic Dimensionality
Intrinsic Dimensionality attempts to estimate how the local observations populate the surrounding price neighborhood.
The indicator compares the proportion of observations located inside:
Radius R and Radius 2R
The change in neighborhood occupancy as the radius expands provides a simplified estimate of local dimensional structure.
The result is bounded according to the configured k-nearest-neighbor setting and normalized for visualization.
Interpretation
Rather than giving a direct bullish/bearish signal, Intrinsic Dimensionality is intended as a structural diagnostic.
Changes in this value can indicate that the local organization of price observations is changing.
It is best interpreted together with the other geometric measurements rather than independently.
6. Embedding Coordinate
GML also calculates a directional coordinate from the signed movement of price relative to the total travelled geodesic distance.
The value is bounded between -1 and +1 and subsequently smoothed.
This produces the Embedding Coordinate displayed as an area plot.
General interpretation
Toward +1:
Recent movement is increasingly aligned in the positive direction.
Toward -1:
Recent movement is increasingly aligned in the negative direction.
Around zero:
Directional movement is more balanced relative to the travelled path.
The script specifically monitors transitions through -0.5 and +0.5 as components of its signal logic.
7. Geodesic Mean
The yellow Geodesic Mean displayed on the main price chart is the simple average of the selected price source across the embedding window.
It provides a price-level reference alongside the geometric measurements displayed in the oscillator pane.
It should not be interpreted as a standalone entry or exit signal.
Signal Logic
GML includes two types of visual signals.
R — Manifold Reversal
The green "R" marker represents a potential local structural reversal condition.
It requires several conditions to occur together:
• Local curvature is unusually high
• The embedding coordinate crosses upward through its lower structural region
• The local kNN neighborhood is relatively tight
• Tangent projection is still negative but recovering
The purpose of combining these conditions is to identify situations where price has experienced significant local bending while its embedded directional structure begins recovering from a negative region.
An R marker does not mean that price must reverse.
It indicates that the script's specific geometric reversal conditions have occurred simultaneously.
C — Manifold Continuation
The red "C" marker represents a potential directional continuation condition.
It requires:
• A relatively linear geodesic path
• The embedding coordinate crossing downward through its upper structural region
• A relatively loose kNN neighborhood
This combination is intended to identify a different geometric regime from the reversal condition.
The C marker should therefore be interpreted as a structural continuation condition generated by the model, not as a guaranteed short signal.
How to Read the Indicator
Instead of focusing on a single line, GML is designed to be interpreted as a collection of geometric measurements.
A practical workflow is:
Step 1 — Observe the Embedding Coordinate
Start with the green/red area plot.
Watch how the coordinate behaves around:
+0.5
0
-0.5
Movement from an extreme region toward the center can indicate a change in the directional organization of the recent path.
Step 2 — Check Curvature
Next, examine Local Curvature.
A curvature expansion indicates that price is bending more sharply than it normally has during the current observation period.
High curvature combined with a change in embedding direction can be more informative than curvature alone.
Step 3 — Examine Neighborhood Structure
Use kNN Tightness to determine whether recent observations are relatively concentrated or dispersed.
This helps distinguish different local geometric environments.
Step 4 — Check Tangent Projection
Tangent Projection helps determine where price sits relative to its recent local structure.
For example, a negative tangent projection that begins rising can indicate recovery toward the local center.
Step 5 — Examine Geodesic Behavior
Use the Geodesic Ratio Z-score to understand whether the current price path is relatively direct or unusually indirect.
This provides additional context regarding the efficiency and complexity of recent movement.
Step 6 — Use Signals as Confluence
R and C markers are intentionally generated from multiple conditions.
They are best treated as indications that a specific combination of geometric conditions has occurred rather than as automatic trade instructions.
Users can combine GML with their own analysis of:
• Market structure
• Support and resistance
• Trend direction
• Volume
• Volatility
• Risk management
How Traders Can Use GML
GML can be used in several ways.
Structural Reversal Analysis
Look for situations where curvature expands while the embedding coordinate begins recovering from an extreme region.
This can help identify areas where the geometry of recent price movement is changing.
Trend/Path Quality Analysis
The Geodesic Ratio can help distinguish relatively direct price movement from more complicated paths.
This can provide additional context when evaluating an existing trend.
Compression and Dispersion Analysis
kNN neighborhood measurements provide information about whether recent observations are relatively concentrated or dispersed.
This can help characterize the local market regime.
Confirmation Tool
GML can also be used as a secondary analytical layer alongside an existing trading methodology.
For example, a trader may first identify a setup using market structure and then examine whether GML shows a corresponding change in curvature, embedding direction, or neighborhood structure.
Inputs
Embedding Dimension (N)
Defines the number of recent observations used to construct the local geometric window.
Lower values make the measurements more sensitive to recent price changes.
Higher values analyze a broader local structure and generally produce slower-changing measurements.
Default: 20
k-Nearest Neighbors
Controls the dimensional normalization/reference used by the local-neighborhood calculations.
Default: 5
Smoothing Length
Controls smoothing of the embedding coordinate and the local window used by the tangent-related calculation.
Lower values respond more quickly.
Higher values produce smoother measurements.
Default: 5
Curvature Threshold
Controls the Z-score threshold required for curvature to qualify as unusually high within the reversal condition.
Higher values require more extreme curvature.
Default: 0.5
Price Source
Available sources include:
Close
Open
HL2
HLC3
OHLC4
Default: HLC3
Changing the source changes the price series used by the geometric calculations.
Display Controls
Individual components can be enabled or disabled from the settings:
Show Geodesic Distance
Show Local Curvature
Show Tangent Projection
Show Intrinsic Dimensionality
Show Geodesic Mean on Price Chart
Show Signals
This allows users to simplify the display and focus on the measurements relevant to their analysis.
Information Table
The table in the upper-right corner provides the current values of several important measurements:
Geo Ratio
Curvature Z-score
Tangent Projection
Intrinsic Dimension
Embedding Coordinate
kNN Average Distance
Geodesic Mean
The table is intended to provide a compact numerical view of the current geometric state.
Alerts
The indicator provides alert conditions for:
Manifold Reversal
and
Manifold Continuation
Users can create TradingView alerts from these conditions if they want to monitor when the corresponding geometric setup occurs.
An alert indicates that the defined conditions were satisfied; it does not guarantee that the subsequent market movement will follow any particular direction or magnitude.
Why This Indicator Is Different
GML is not intended to be another conventional oscillator created by combining RSI, MACD, or moving-average crossover conditions.
Its primary calculations are built around geometric characteristics of the recent price path:
• travelled path versus direct displacement
• local curvature
• local tangent/deviation
• nearest-neighborhood distances
• neighborhood scaling
• directional embedding
These measurements are combined to provide a different representation of local market structure.
The purpose is to explore how the geometry of recent price observations changes over time rather than attempting to directly forecast future prices.
Important Limitations
GML is a simplified application of geometric and manifold-inspired concepts to a one-dimensional market price series.
It should not be interpreted as a full academic manifold-learning implementation such as Isomap, locally linear embedding, diffusion maps, or another high-dimensional machine-learning algorithm.
The kNN, geodesic, curvature, dimensionality, and embedding calculations used here are purpose-built approximations designed for real-time chart analysis within Pine Script.
Market prices are noisy and non-stationary. Similar geometric conditions can lead to different outcomes under different market environments.
Signals may also occur during sideways markets, volatile periods, news events, gaps, or other abnormal conditions.
No geometric measurement can determine future market direction with certainty.
Recommended Usage
GML is best used as an analytical and confluence tool rather than as a standalone trading system.
Users should evaluate signals in the context of their own:
market structure analysis, risk tolerance, instrument, timeframe, execution method, and risk-management rules.
Different instruments and timeframes can produce substantially different geometric behavior, so users are encouraged to study the indicator across historical market conditions before incorporating it into their process.
Educational Purpose
Geometry | Manifold Learning is provided as an analytical and educational tool for studying price behavior.
It does not provide investment advice, does not guarantee trading performance, and does not predict future market outcomes.
The calculations describe mathematical properties of historical and current price observations. Any trading decision and associated risk remain the responsibility of the user.
Traditional technical indicators often reduce market behavior to trend, momentum, volatility, or moving averages. GML takes a different approach: it treats recent price observations as points belonging to a locally evolving geometric structure, or "manifold."
The objective is not to predict future prices. Instead, the indicator attempts to describe the current structure of price movement by measuring:
• Geodesic path behavior
• Local price curvature
• Tangent projection
• Local neighborhood density using k-nearest-neighbor concepts
• Intrinsic dimensionality
• Normalized embedding direction
• Local geometric mean
These measurements are combined into a multi-component oscillator designed to help traders study whether recent price action is relatively directional, compressed, dispersed, curved, or undergoing a structural transition.
Core Concept
Financial prices do not always move efficiently from one level to another.
For example, price may begin at 100 and end at 105.
The direct displacement is only 5 points, but the actual path could have travelled:
100 → 103 → 101 → 106 → 102 → 105
The total distance travelled is substantially greater than the final displacement.
GML uses this distinction between direct displacement and travelled path as one way of describing the geometry of recent price action.
A relatively direct path may indicate more organized directional movement, while a large travelled path relative to displacement can indicate a more complex or inefficient local structure.
This concept forms the foundation of the indicator's Geodesic Ratio.
1. Geodesic Ratio
The indicator calculates two distances over the selected embedding window.
Euclidean Distance:
The absolute difference between the current price and the price at the opposite end of the observation window.
Geodesic Distance:
The cumulative absolute movement between consecutive observations within the same window.
The ratio is then calculated conceptually as:
Geodesic Ratio = Travelled Path / Direct Displacement
A larger ratio means price travelled a relatively complicated path to reach its current location.
A smaller ratio represents a more direct path.
The ratio is normalized using its historical mean and standard deviation to produce the displayed Geodesic Ratio Z-score.
Interpretation
Positive/high readings can indicate that the recent path is relatively complex or indirect.
Negative/low readings indicate that the path is relatively more linear compared with its recent behavior.
This measurement should not independently be interpreted as bullish or bearish. It describes the geometry of the path rather than its direction.
2. Local Curvature
GML estimates local curvature using first- and second-order changes in price.
The first difference measures local price movement, while the second difference measures how rapidly that movement itself is changing.
Conceptually, high curvature represents a sharper local bend in the price path.
The raw curvature measurement is normalized into a Z-score relative to its recent history.
Interpretation
Higher positive Curvature Z-scores indicate that the current local bend is unusually large compared with recent observations.
Lower readings indicate a relatively smoother local trajectory.
High curvature does NOT automatically indicate a market reversal.
It simply identifies an area where the local geometry of price has changed more sharply than normal.
The Curvature Threshold input controls how unusual curvature must become before it qualifies as a high-curvature condition within the signal logic.
3. Tangent Projection
The Tangent Projection measures the position of current price relative to a locally smoothed price structure.
The script calculates a local mean and standard deviation over the selected smoothing period and normalizes the current deviation from that local mean.
This creates a standardized representation of where price currently sits relative to its recent local structure.
General interpretation
Above zero:
Price is positioned above its local mean.
Below zero:
Price is positioned below its local mean.
Movement toward zero:
Price is returning toward its local center.
Movement away from zero:
Price is extending farther away from the local center.
The reversal logic additionally examines whether a negative tangent projection has begun recovering.
4. k-Nearest-Neighborhood Distance
The indicator compares the current price with observations inside the selected embedding window and identifies nearby observations based on absolute price distance.
The average distance of the nearest observations provides a local neighborhood-radius estimate.
This value is then normalized relative to its recent history.
Interpretation
Negative kNN Z-score:
The local neighborhood is relatively tight compared with recent conditions.
Positive kNN Z-score:
The local neighborhood is relatively dispersed.
This can be thought of as a geometric measure of local price concentration rather than a conventional volatility indicator.
The signal engine uses this information to distinguish between tighter and looser local structures.
5. Intrinsic Dimensionality
Intrinsic Dimensionality attempts to estimate how the local observations populate the surrounding price neighborhood.
The indicator compares the proportion of observations located inside:
Radius R and Radius 2R
The change in neighborhood occupancy as the radius expands provides a simplified estimate of local dimensional structure.
The result is bounded according to the configured k-nearest-neighbor setting and normalized for visualization.
Interpretation
Rather than giving a direct bullish/bearish signal, Intrinsic Dimensionality is intended as a structural diagnostic.
Changes in this value can indicate that the local organization of price observations is changing.
It is best interpreted together with the other geometric measurements rather than independently.
6. Embedding Coordinate
GML also calculates a directional coordinate from the signed movement of price relative to the total travelled geodesic distance.
The value is bounded between -1 and +1 and subsequently smoothed.
This produces the Embedding Coordinate displayed as an area plot.
General interpretation
Toward +1:
Recent movement is increasingly aligned in the positive direction.
Toward -1:
Recent movement is increasingly aligned in the negative direction.
Around zero:
Directional movement is more balanced relative to the travelled path.
The script specifically monitors transitions through -0.5 and +0.5 as components of its signal logic.
7. Geodesic Mean
The yellow Geodesic Mean displayed on the main price chart is the simple average of the selected price source across the embedding window.
It provides a price-level reference alongside the geometric measurements displayed in the oscillator pane.
It should not be interpreted as a standalone entry or exit signal.
Signal Logic
GML includes two types of visual signals.
R — Manifold Reversal
The green "R" marker represents a potential local structural reversal condition.
It requires several conditions to occur together:
• Local curvature is unusually high
• The embedding coordinate crosses upward through its lower structural region
• The local kNN neighborhood is relatively tight
• Tangent projection is still negative but recovering
The purpose of combining these conditions is to identify situations where price has experienced significant local bending while its embedded directional structure begins recovering from a negative region.
An R marker does not mean that price must reverse.
It indicates that the script's specific geometric reversal conditions have occurred simultaneously.
C — Manifold Continuation
The red "C" marker represents a potential directional continuation condition.
It requires:
• A relatively linear geodesic path
• The embedding coordinate crossing downward through its upper structural region
• A relatively loose kNN neighborhood
This combination is intended to identify a different geometric regime from the reversal condition.
The C marker should therefore be interpreted as a structural continuation condition generated by the model, not as a guaranteed short signal.
How to Read the Indicator
Instead of focusing on a single line, GML is designed to be interpreted as a collection of geometric measurements.
A practical workflow is:
Step 1 — Observe the Embedding Coordinate
Start with the green/red area plot.
Watch how the coordinate behaves around:
+0.5
0
-0.5
Movement from an extreme region toward the center can indicate a change in the directional organization of the recent path.
Step 2 — Check Curvature
Next, examine Local Curvature.
A curvature expansion indicates that price is bending more sharply than it normally has during the current observation period.
High curvature combined with a change in embedding direction can be more informative than curvature alone.
Step 3 — Examine Neighborhood Structure
Use kNN Tightness to determine whether recent observations are relatively concentrated or dispersed.
This helps distinguish different local geometric environments.
Step 4 — Check Tangent Projection
Tangent Projection helps determine where price sits relative to its recent local structure.
For example, a negative tangent projection that begins rising can indicate recovery toward the local center.
Step 5 — Examine Geodesic Behavior
Use the Geodesic Ratio Z-score to understand whether the current price path is relatively direct or unusually indirect.
This provides additional context regarding the efficiency and complexity of recent movement.
Step 6 — Use Signals as Confluence
R and C markers are intentionally generated from multiple conditions.
They are best treated as indications that a specific combination of geometric conditions has occurred rather than as automatic trade instructions.
Users can combine GML with their own analysis of:
• Market structure
• Support and resistance
• Trend direction
• Volume
• Volatility
• Risk management
How Traders Can Use GML
GML can be used in several ways.
Structural Reversal Analysis
Look for situations where curvature expands while the embedding coordinate begins recovering from an extreme region.
This can help identify areas where the geometry of recent price movement is changing.
Trend/Path Quality Analysis
The Geodesic Ratio can help distinguish relatively direct price movement from more complicated paths.
This can provide additional context when evaluating an existing trend.
Compression and Dispersion Analysis
kNN neighborhood measurements provide information about whether recent observations are relatively concentrated or dispersed.
This can help characterize the local market regime.
Confirmation Tool
GML can also be used as a secondary analytical layer alongside an existing trading methodology.
For example, a trader may first identify a setup using market structure and then examine whether GML shows a corresponding change in curvature, embedding direction, or neighborhood structure.
Inputs
Embedding Dimension (N)
Defines the number of recent observations used to construct the local geometric window.
Lower values make the measurements more sensitive to recent price changes.
Higher values analyze a broader local structure and generally produce slower-changing measurements.
Default: 20
k-Nearest Neighbors
Controls the dimensional normalization/reference used by the local-neighborhood calculations.
Default: 5
Smoothing Length
Controls smoothing of the embedding coordinate and the local window used by the tangent-related calculation.
Lower values respond more quickly.
Higher values produce smoother measurements.
Default: 5
Curvature Threshold
Controls the Z-score threshold required for curvature to qualify as unusually high within the reversal condition.
Higher values require more extreme curvature.
Default: 0.5
Price Source
Available sources include:
Close
Open
HL2
HLC3
OHLC4
Default: HLC3
Changing the source changes the price series used by the geometric calculations.
Display Controls
Individual components can be enabled or disabled from the settings:
Show Geodesic Distance
Show Local Curvature
Show Tangent Projection
Show Intrinsic Dimensionality
Show Geodesic Mean on Price Chart
Show Signals
This allows users to simplify the display and focus on the measurements relevant to their analysis.
Information Table
The table in the upper-right corner provides the current values of several important measurements:
Geo Ratio
Curvature Z-score
Tangent Projection
Intrinsic Dimension
Embedding Coordinate
kNN Average Distance
Geodesic Mean
The table is intended to provide a compact numerical view of the current geometric state.
Alerts
The indicator provides alert conditions for:
Manifold Reversal
and
Manifold Continuation
Users can create TradingView alerts from these conditions if they want to monitor when the corresponding geometric setup occurs.
An alert indicates that the defined conditions were satisfied; it does not guarantee that the subsequent market movement will follow any particular direction or magnitude.
Why This Indicator Is Different
GML is not intended to be another conventional oscillator created by combining RSI, MACD, or moving-average crossover conditions.
Its primary calculations are built around geometric characteristics of the recent price path:
• travelled path versus direct displacement
• local curvature
• local tangent/deviation
• nearest-neighborhood distances
• neighborhood scaling
• directional embedding
These measurements are combined to provide a different representation of local market structure.
The purpose is to explore how the geometry of recent price observations changes over time rather than attempting to directly forecast future prices.
Important Limitations
GML is a simplified application of geometric and manifold-inspired concepts to a one-dimensional market price series.
It should not be interpreted as a full academic manifold-learning implementation such as Isomap, locally linear embedding, diffusion maps, or another high-dimensional machine-learning algorithm.
The kNN, geodesic, curvature, dimensionality, and embedding calculations used here are purpose-built approximations designed for real-time chart analysis within Pine Script.
Market prices are noisy and non-stationary. Similar geometric conditions can lead to different outcomes under different market environments.
Signals may also occur during sideways markets, volatile periods, news events, gaps, or other abnormal conditions.
No geometric measurement can determine future market direction with certainty.
Recommended Usage
GML is best used as an analytical and confluence tool rather than as a standalone trading system.
Users should evaluate signals in the context of their own:
market structure analysis, risk tolerance, instrument, timeframe, execution method, and risk-management rules.
Different instruments and timeframes can produce substantially different geometric behavior, so users are encouraged to study the indicator across historical market conditions before incorporating it into their process.
Educational Purpose
Geometry | Manifold Learning is provided as an analytical and educational tool for studying price behavior.
It does not provide investment advice, does not guarantee trading performance, and does not predict future market outcomes.
The calculations describe mathematical properties of historical and current price observations. Any trading decision and associated risk remain the responsibility of the user.
סקריפט קוד פתוח
ברוח האמיתית של TradingView, יוצר הסקריפט הזה הפך אותו לקוד פתוח, כך שסוחרים יוכלו לעיין בו ולאמת את פעולתו. כל הכבוד למחבר! אמנם ניתן להשתמש בו בחינם, אך זכור כי פרסום חוזר של הקוד כפוף ל־כללי הבית שלנו.

Unlock powerful tools & indicators → pointalgo.com
כתב ויתור
המידע והפרסומים אינם מיועדים להיות, ואינם מהווים, ייעוץ או המלצה פיננסית, השקעתית, מסחרית או מכל סוג אחר המסופקת או מאושרת על ידי TradingView. קרא עוד ב־תנאי השימוש.
סקריפט קוד פתוח
ברוח האמיתית של TradingView, יוצר הסקריפט הזה הפך אותו לקוד פתוח, כך שסוחרים יוכלו לעיין בו ולאמת את פעולתו. כל הכבוד למחבר! אמנם ניתן להשתמש בו בחינם, אך זכור כי פרסום חוזר של הקוד כפוף ל־כללי הבית שלנו.
Unlock powerful tools & indicators → pointalgo.com
כתב ויתור
המידע והפרסומים אינם מיועדים להיות, ואינם מהווים, ייעוץ או המלצה פיננסית, השקעתית, מסחרית או מכל סוג אחר המסופקת או מאושרת על ידי TradingView. קרא עוד ב־תנאי השימוש.