OPEN-SOURCE SCRIPT
HTF Delta Flux + Liquidations [BigBeluga]
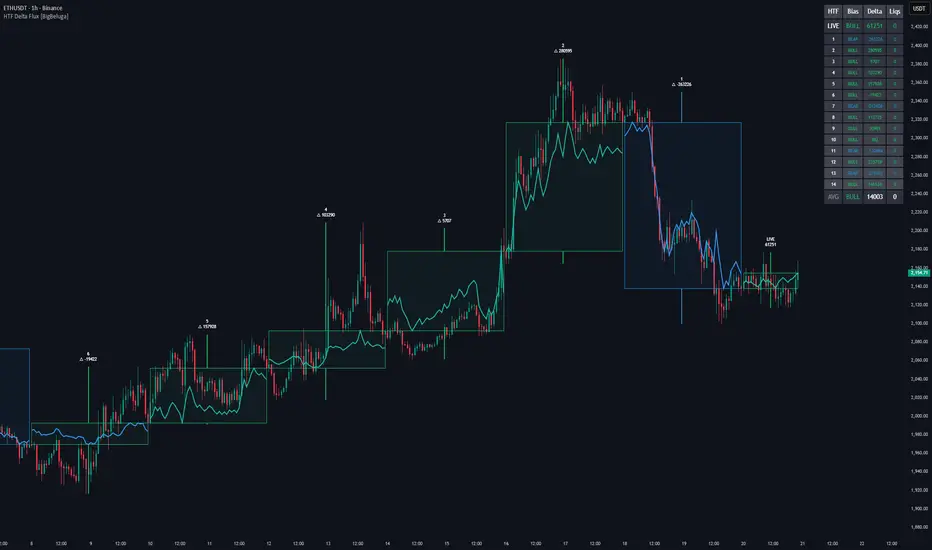
HTF Delta Flux + Liquidations [BigBeluga] is a high-timeframe order flow diagnostic tool that visualizes the internal volume dynamics of macro candles. By projecting Higher Timeframe (HTF) structures onto your current chart, it reveals the "Flux"—the movement of Cumulative Volume Delta—and identifies high-velocity volume spikes often associated with liquidations.
Unlike standard indicators that only show a candle’s open and close, this script breaks down the aggressive buying and selling that occurred inside the candle’s duration.
🔵 CONCEPTS
🔵 THE SYNTHETIC LIQUIDATION ENGINE
It is important to note: This indicator does not use real-time exchange liquidation API data. Since TradingView does not provide native exchange-level liquidation feeds for all symbols, this tool uses a Volume-Based Proxy to identify liquidation-like events.
How it works:
The engine monitors the rate of change in Volume Delta. When a volume spike exceeds a specific Standard Deviation threshold relative to recent activity, it identifies a "Liquidity Flush." In the market, these extreme, sudden bursts of volume often correlate with forced liquidations or stop-run cascades.
🔵 FEATURES
🔵 HOW TO USE
🔵 CONCLUSION
HTF Delta Flux + Liquidations [BigBeluga] bridges the gap between macro structure and micro order flow. By transforming raw volume into a visual "Flux" path and highlighting mathematical volume anomalies, it provides traders with a sophisticated map of institutional aggression and retail exhaustion.
Unlike standard indicators that only show a candle’s open and close, this script breaks down the aggressive buying and selling that occurred inside the candle’s duration.
🔵 CONCEPTS
- HTF Candle Boxes: Automatically draws the body and wicks of a higher timeframe (e.g., Daily or Weekly) over your intraday price action.
- The Delta Flux Curve: An internal polyline that maps the path of Cumulative Volume Delta within the HTF candle. This allows you to see if a candle’s volume was "front-loaded" or "back-loaded."
- Full Body Mode: A visual toggle that expands the candle box to cover the entire High-Low range, creating a "Liquidity Zone" view.
- Cumulative Delta Dashboard: A real-time table tracking the last N HTF candles, displaying their directional bias, total delta, and the volume contributed by liquidation flushes.
🔵 THE SYNTHETIC LIQUIDATION ENGINE
It is important to note: This indicator does not use real-time exchange liquidation API data. Since TradingView does not provide native exchange-level liquidation feeds for all symbols, this tool uses a Volume-Based Proxy to identify liquidation-like events.
How it works:
The engine monitors the rate of change in Volume Delta. When a volume spike exceeds a specific Standard Deviation threshold relative to recent activity, it identifies a "Liquidity Flush." In the market, these extreme, sudden bursts of volume often correlate with forced liquidations or stop-run cascades.
- Circle Markers: Appear at the high or low of the bar where the flush occurred.
- Volume Labels: Display the specific amount of aggressive delta that triggered the signal.
🔵 FEATURES
- Customizable HTF Timeframe: Analyze Daily, Weekly, or even Monthly order flow on 1-minute or 5-minute charts.
- Standard Deviation Sensitivity: Fine-tune the "Dev Threshold" to filter out minor volume noise and only highlight the most significant liquidity events.
- Live Delta Tracking: The current "Live" candle displays a real-time count of the active delta flux.
- Historical Bias Analysis: The dashboard calculates the average bias and liquidation volume over your selected history to identify macro trend exhaustion.
🔵 HOW TO USE
- Spotting Absorption: If you see a large Bullish HTF candle but the Delta Flux Curve is trending downward, it suggests aggressive selling is being absorbed by limit buyers.
- Trading the "Flush": Liquidation labels (circles) often mark the local top or bottom of a move. When a "Liq" label appears after a fast price extension, it frequently signals a temporary exhaustion of the move.
- Trend Confluence: Use the Dashboard to see if "Average Liq Volume" is increasing. Rising liquidation volume at the end of a trend often precedes a major reversal.
- Intra-Candle Context: Watch the Delta Curve. If price is moving higher but the curve is flat, the move is likely low-conviction and prone to a retracement.
🔵 CONCLUSION
HTF Delta Flux + Liquidations [BigBeluga] bridges the gap between macro structure and micro order flow. By transforming raw volume into a visual "Flux" path and highlighting mathematical volume anomalies, it provides traders with a sophisticated map of institutional aggression and retail exhaustion.
סקריפט קוד פתוח
ברוח האמיתית של TradingView, יוצר הסקריפט הזה הפך אותו לקוד פתוח, כך שסוחרים יוכלו לעיין בו ולאמת את פעולתו. כל הכבוד למחבר! אמנם ניתן להשתמש בו בחינם, אך זכור כי פרסום חוזר של הקוד כפוף ל־כללי הבית שלנו.

🔵Gain access to our powerful tools : bigbeluga.com/tv
🔵Join our free discord for updates : discord.com/invite/FuW63RKgdc
All scripts & content provided by BigBeluga are for informational & educational purposes only.
🔵Join our free discord for updates : discord.com/invite/FuW63RKgdc
All scripts & content provided by BigBeluga are for informational & educational purposes only.
כתב ויתור
המידע והפרסומים אינם מיועדים להיות, ואינם מהווים, ייעוץ או המלצה פיננסית, השקעתית, מסחרית או מכל סוג אחר המסופקת או מאושרת על ידי TradingView. קרא עוד ב־תנאי השימוש.
סקריפט קוד פתוח
ברוח האמיתית של TradingView, יוצר הסקריפט הזה הפך אותו לקוד פתוח, כך שסוחרים יוכלו לעיין בו ולאמת את פעולתו. כל הכבוד למחבר! אמנם ניתן להשתמש בו בחינם, אך זכור כי פרסום חוזר של הקוד כפוף ל־כללי הבית שלנו.
🔵Gain access to our powerful tools : bigbeluga.com/tv
🔵Join our free discord for updates : discord.com/invite/FuW63RKgdc
All scripts & content provided by BigBeluga are for informational & educational purposes only.
🔵Join our free discord for updates : discord.com/invite/FuW63RKgdc
All scripts & content provided by BigBeluga are for informational & educational purposes only.
כתב ויתור
המידע והפרסומים אינם מיועדים להיות, ואינם מהווים, ייעוץ או המלצה פיננסית, השקעתית, מסחרית או מכל סוג אחר המסופקת או מאושרת על ידי TradingView. קרא עוד ב־תנאי השימוש.