Morning Range Filter (Trade / Skip)
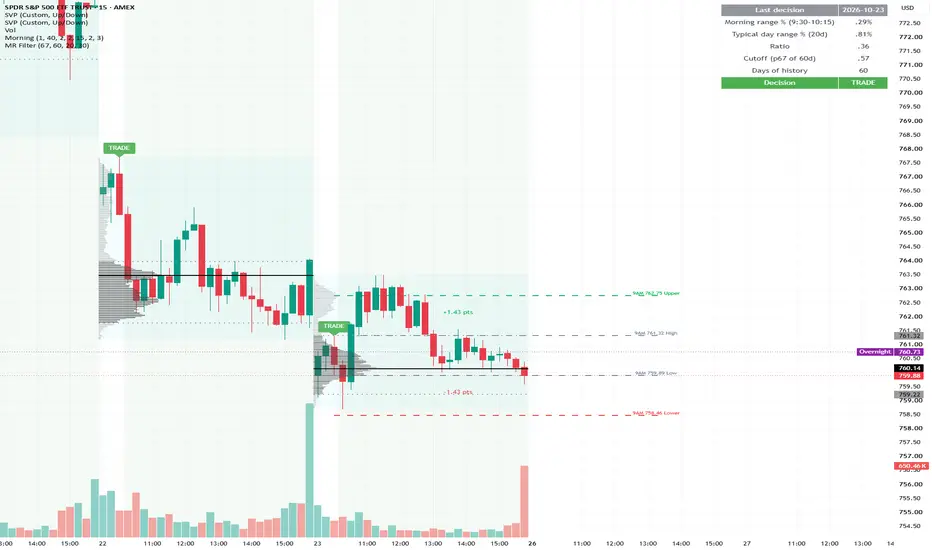
The script is a TradingView indicator that decides each day, at 10:15 ET, whether to trade or skip when writing far-strike condors. It does this by checking whether the first 45 minutes of trading were bigger than usual. It only answers the one question of whether the morning was unusually big.
1. Settings you can change
The percentile cutoff for skipping (67).
The number of past days used to set that cutoff (60).
The number of days used for a “typical day” (20).
The minimum history it needs before it will judge (30 days).
Two display toggles: tinting the rest of the day and showing the table.
2. Safety check
It stops with an error if your chart is longer than 15 minutes. The calculation needs bars that end exactly at 10:15, and a 30-minute bar doesn’t.
3. Reading the clock
It converts every bar’s end time to New York time. That keeps it correct on the days when daylight saving shifts your computer’s clock.
It also detects when a new trading day starts and resets that day’s numbers.
4. The “typical day” number
It asks TradingView for the daily bars and takes the average of (high − low) ÷ close over the previous 20 days. It uses yesterday’s value, so it never peeks at today.
5. The morning range
From the open until the bar that ends at 10:15, it keeps track of the day’s highest high and lowest low.
6. The decision at 10:15 (once per day, only when that bar is complete)
Ratio: morning range as a percent of price, divided by the typical day’s range. For example, 0.77% ÷ 1.22% = 0.63.
Cutoff: the 67th percentile of the ratios from the previous 60 days, using the same interpolation as my backtest. It uses only past days, so today isn’t part of its own cutoff.
Result: SKIP if the ratio is above the cutoff, otherwise TRADE. If it has fewer than 30 days of history, it shows “building history” and doesn’t decide.
History: after deciding, it adds today’s ratio to the record and drops the oldest day once there are more than 60.
7. What you see
A red SKIP or green TRADE label at the top of the 10:15 bar. Hover over it to see the ratio and cutoff.
The rest of the day (10:15 to 16:00) tinted the same color.
Two alerts you can set up, “Skip today” and “Trade today,” so TradingView can notify you at 10:15.
A table in the top-right corner with the date, morning range %, typical range %, ratio, cutoff, days of history and the decision.
1. Settings you can change
The percentile cutoff for skipping (67).
The number of past days used to set that cutoff (60).
The number of days used for a “typical day” (20).
The minimum history it needs before it will judge (30 days).
Two display toggles: tinting the rest of the day and showing the table.
2. Safety check
It stops with an error if your chart is longer than 15 minutes. The calculation needs bars that end exactly at 10:15, and a 30-minute bar doesn’t.
3. Reading the clock
It converts every bar’s end time to New York time. That keeps it correct on the days when daylight saving shifts your computer’s clock.
It also detects when a new trading day starts and resets that day’s numbers.
4. The “typical day” number
It asks TradingView for the daily bars and takes the average of (high − low) ÷ close over the previous 20 days. It uses yesterday’s value, so it never peeks at today.
5. The morning range
From the open until the bar that ends at 10:15, it keeps track of the day’s highest high and lowest low.
6. The decision at 10:15 (once per day, only when that bar is complete)
Ratio: morning range as a percent of price, divided by the typical day’s range. For example, 0.77% ÷ 1.22% = 0.63.
Cutoff: the 67th percentile of the ratios from the previous 60 days, using the same interpolation as my backtest. It uses only past days, so today isn’t part of its own cutoff.
Result: SKIP if the ratio is above the cutoff, otherwise TRADE. If it has fewer than 30 days of history, it shows “building history” and doesn’t decide.
History: after deciding, it adds today’s ratio to the record and drops the oldest day once there are more than 60.
7. What you see
A red SKIP or green TRADE label at the top of the 10:15 bar. Hover over it to see the ratio and cutoff.
The rest of the day (10:15 to 16:00) tinted the same color.
Two alerts you can set up, “Skip today” and “Trade today,” so TradingView can notify you at 10:15.
A table in the top-right corner with the date, morning range %, typical range %, ratio, cutoff, days of history and the decision.

כתב ויתור
המידע והפרסומים אינם מיועדים להיות, ואינם מהווים, ייעוץ או המלצה פיננסית, השקעתית, מסחרית או מכל סוג אחר המסופקת או מאושרת על ידי TradingView. קרא עוד ב־תנאי השימוש.
כתב ויתור
המידע והפרסומים אינם מיועדים להיות, ואינם מהווים, ייעוץ או המלצה פיננסית, השקעתית, מסחרית או מכל סוג אחר המסופקת או מאושרת על ידי TradingView. קרא עוד ב־תנאי השימוש.