Strong Transient Zones | ProjectSyndicate
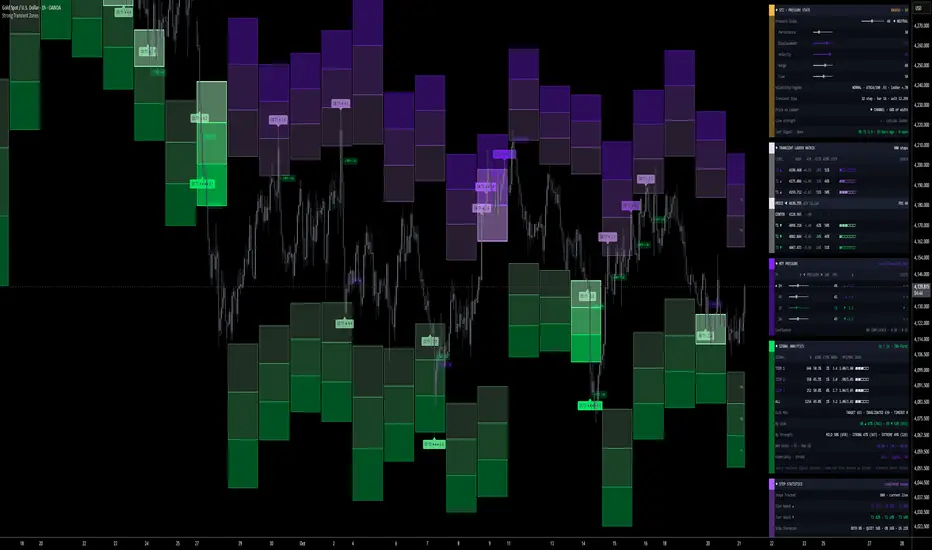
▪️Strong Transient Zones takes the one thing every trader argues about, "is this overbought or oversold," and stops treating it as a fixed line. Classic oscillators pin the same 70/30 level on a dead-quiet range and a vertical blow-off alike, then repaint the moment volatility shifts. This indicator throws that out. It rebuilds the overbought and oversold map from scratch on every step of the chart, freezes a fresh tier ladder from the volatility that is actually present, scores every push into it with a five-factor Pressure Index, and keeps an honest record of what happened next. The zones are transient by design: each new step re-anchors them, so what counted as stretched an hour ago does not haunt the chart now.
▪️The result is the stepped neon staircase you see on the chart. At the start of every step the engine freezes an adaptive center and a volatility unit, then stacks three tier blocks above it (the overbought ladder) and three below (the oversold ladder). Price climbing through Tier 1 → Tier 2 → Tier 3 is the market getting progressively more stretched from its own fair value, measured in units that already know the current regime. A tier lights up the instant price closes inside it while the Pressure Index agrees, so the exhaustion is shown where it is happening, on the candles, not buried in a sub-pane.
▪️Most overbought/oversold tools give you one oscillator and two static lines. This one measures the stretch five independent ways, grades every entry into a zone 0–10, follows each one to a resolved outcome, and lays the whole record out in a five-panel dashboard. It tells you not just that price is stretched, but how stretched, how that compares to this market's own history, and whether stretches like this one have tended to snap back.
🎯 The Pressure Index (the core). A single 0–100 reading, 0 = fully oversold, 100 = fully overbought, built from five symmetric components so no one input can run the show:
Persistence — distance-weighted time price has spent above or below the frozen center across the measurement window, not a binary count.
Displacement — how far the current close sits from the center, in ATR units.
Velocity — the z-scored rate of change, so a genuine momentum burst reads differently from a drift.
Range — where price sits inside its own recent high/low channel.
Flow — volume-weighted close location, the effort behind the move, dropped automatically on symbols without volume.
The blend is regime-aware: when short-term volatility outruns long-term, the whole ladder widens so a volatile market is not flagged as exhausted on every candle, and tightens again when things go quiet.
⭐ Strength Score (0–10). Every zone entry is graded before its label is drawn, from tier depth, how far past the threshold the Pressure Index is, the volume climax on the bar, and the velocity burst behind it. A plain Tier-1 tap and an extreme Tier-3 thrust on a volume spike are not the same event, and the score, the star rating and the label opacity all say so. One input, Min Signal Strength, is the single gate: lower it for more signals off weaker zones, raise it to see only the strong ones.
📡 Signals on every tier, not once a cycle. A signal fires on the first confirmed close inside each tier, per side, per step. As price pushes deeper, Tier 1, then Tier 2, then Tier 3 can each fire in turn, so a strong thrust is tracked the whole way out instead of giving one early flag and going quiet. Wicks never trigger a signal; only a confirmed close does. Pressure gating is optional, off by default, so the zones themselves carry the signal and nothing worth marking is filtered away.
📊 The Ladder Matrix That Shows Its Record. Six tiers sit in the dashboard, three above price and three below, split by a live PRICE row dropped exactly where price is trading. Each tier reports HIT% — the share of completed steps in which a wick reached it — and WIN% — how often a signal from that tier resolved in your favor — alongside its edge price, its distance from price in ATR, a reach gauge, and a ✓ if it was touched this step. Hot tiers are flagged. The read is instant: how rare is this level, and how has price behaved the last time it got here.
🔬 Honest Outcome Model. Every signal is a mean-reversion thesis with a symmetric R-model, and the baseline is deliberately fair. The target sits a set number of ladder units back toward the frozen center; the invalidation sits the same distance beyond. Because the two are symmetric, a coin flip scores 50%, so a WIN% above 50 on your chart is real edge, not an artifact of a target that was easier to hit than the stop. A same-bar tie where price touches both is booked as a loss, never a win. A signal that hits neither inside the max-hold window is booked as a timeout and still counted. On top of that, center-reach is tracked separately: did price make it all the way back to fair value, not just to the target.
🧪 Nothing is hidden. Every resolved signal is counted in the statistics and keeps its marker on the chart: ✓ REV for a target hit, ✕ EXT for an invalidation, ◦ END for a timeout. Losers are never dropped to flatter the win rate, same-bar ambiguity is always resolved against the signal, and timeouts are shown rather than swept away. The Signal Analytics panel reports, by tier and by side and by strength bucket: count, WIN%, center-reach rate, average bars to target, average MFE/MAE in ladder units, the full exit mix, net units, profit factor, max drawdown, expectancy and the current streak.
📈 Step Statistics. Booked only when a step completes, so the live step never inflates the rates: how often each tier is reached on the upper and lower ladders, how often both ladders are touched in one step (the two-way days), how often a step stays quiet, the average excursion from the center in ladder units, and a Calibration verdict that tells you, in plain words, to widen or tighten the Ladder Scale once enough steps are in. The ladder tunes itself to your market from your market's own behavior.
🛰️ MTF Pressure. The Pressure Index for the chart timeframe plus the three higher timeframes above it, each read non-repainting from the last closed higher-timeframe bar, each with its own gauge, value, change since its previous bar, state and ladder tier. A confluence line calls it when the stack agrees: the strongest reversion setups are the ones where the stretch shows up on more than one timeframe at once.
🏛️ Level Hierarchy. The frozen step center is the anchor, the reversion target of every signal. Tier 1 is the first stretch from it, Tier 2 and Tier 3 the progressive extremes, each a fixed ATR thickness scaled by the regime and the step length. Every tier carries its own history rather than being lumped into one overbought/oversold blob.
🎨 Neon On Black, Built To Read. The ladder is a clean stepped staircase: soft tints nearest price, deep saturated neon at the outer tiers. A tier recolors in place the instant it goes hot, no second object stacked on top. Three palettes (Violet/Green, Magenta/Cyan, Amber/Ice) plus a fully custom pair, optional neon borders, tier tags on the live step, optional rejection-wick markers, and an optional step-center line. Signal labels carry the tier, the stars and the score in plain sight.
🔔 Native Alerts. Overbought and oversold signals on any tier, Tier-2-plus signals, extreme signals, pressure crossing into overbought or oversold, Tier-3 wick touches on either side, rejection wicks, a signal reaching its target, a signal being invalidated, pressure leaving a zone, and multi-timeframe overbought/oversold confluence. Every alert names the symbol, the timeframe and the event.
🎯 Why this is different. A fixed oscillator flags the same level in every regime and repaints when the regime turns. This one rebuilds the overbought/oversold map on every step from the volatility actually present, grades each stretch five ways, keeps a fair symmetric record so the win rate means something, shows how often each tier is even reached, tells you when the ladder needs retuning, and counts every signal honestly so the numbers are ones you could have traded.
🚀 Built to adapt. The step anchor (auto higher-timeframe, a custom timeframe, or a fixed bar count), the ladder distances and thickness, the Pressure Index weights and thresholds, the signal gate and the outcome model are all inputs, so it fits FX, metals, indices, crypto or stocks on any timeframe.
💡 Cleanest setup: leave the step anchor on Auto HTF so the ladder re-anchors on a sensible higher timeframe, leave Min Signal Strength at its default for a full signal stream, and let the Step Statistics panel run for a few hundred bars. When the Calibration line reads CALIBRATED you are tuned to the market; when it says tight or wide, nudge the Ladder Scale once and let it settle.
🎯 How To Trade It: Two Approaches
Everything comes down to one question: when price stretches into these zones, does it tend to snap back to fair value or keep extending, and is the stretch in front of you strong enough to lean on?
⚡ 1) Fade the stretch: reversion to the center
Use this on an overbought or oversold signal, taken against the direction of the stretch.
▪️Read the record. You want a score of ★★★ or more, a tier with a healthy WIN% in the matrix, a volume climax on the bar, and ideally multi-timeframe confluence so the stretch is not just a one-timeframe blip.
Trigger: the confirmed tier-entry signal (OS to fade an oversold stretch long, OB to fade an overbought stretch short).
Target: the frozen step center, the reversion target drawn on every signal.
Stop: beyond the next tier edge, the invalidation level drawn on the signal.
Invalidation: a close through that next edge. The stretch extended instead of snapping back, so stand aside.
🧱 2) Respect the extension: when the stretch keeps going
Use the ladder as a map, not every tier as a fade.
▪️Read the record. If the matrix shows a low WIN% from the tier in front of you and price is pushing through tiers with a strong Pressure Index and volume behind it, the market is trending, not reverting. The deeper-tier signals are telling you the move has legs.
Trigger: successive tiers lighting up in the same direction with the Pressure Index pinned and MTF agreeing.
Read: treat the tiers as trailing checkpoints, not reversal points. Wait for a rejection wick or a Pressure Index roll-over before fading.
Watch: the first tier that fails to hold on a close back inside. That is where a trending stretch finally starts to revert.
✋ Stand down: when the dashboard says wait
A live strength below your minimum, or price sitting in the channel between the ladders with no tier entry.
A two-way step where both ladders have already been touched: the step is chopping, not stretching.
Too few tracked steps to trust the hit rates, or the Calibration line still reading "collecting."
A WIN% near 50 on the tier in front of you: this market is not reverting cleanly from here, so the edge is thin.
Price mid-channel with no signal: wait for the close into a tier and let the alert bring you in.
Rule of thumb: ⚡ Deep tier + high score + strong tier WIN% + MTF confluence → fade the stretch back toward the center. 🧱 Tiers stacking in one direction + low reversion WIN% + Pressure pinned → respect the trend, use the ladder as a trail, wait for rejection. ❄️ Low score, both ladders touched, thin sample or an uncalibrated ladder → stand down until the step shows its hand.
▪️Honest statistics. This is a measurement and analysis tool, not a signal service and not a promise that any stretch will revert or extend. The outcome model is symmetric, so a coin flip scores 50% and only a WIN% above that is edge. Every signal is counted, none are dropped for losing, same-bar ties are booked against the signal, timeouts are shown not hidden, and step rates exclude the live step so nothing is flattered. The probabilities are the historical frequencies of this ladder on this market in the bars the indicator can see. They describe how price has behaved when it reached these zones, not how it must behave next. Outcomes are recorded on confirmed closes and a live signal can still change until its bar closes.
▪️The result is the stepped neon staircase you see on the chart. At the start of every step the engine freezes an adaptive center and a volatility unit, then stacks three tier blocks above it (the overbought ladder) and three below (the oversold ladder). Price climbing through Tier 1 → Tier 2 → Tier 3 is the market getting progressively more stretched from its own fair value, measured in units that already know the current regime. A tier lights up the instant price closes inside it while the Pressure Index agrees, so the exhaustion is shown where it is happening, on the candles, not buried in a sub-pane.
▪️Most overbought/oversold tools give you one oscillator and two static lines. This one measures the stretch five independent ways, grades every entry into a zone 0–10, follows each one to a resolved outcome, and lays the whole record out in a five-panel dashboard. It tells you not just that price is stretched, but how stretched, how that compares to this market's own history, and whether stretches like this one have tended to snap back.
🎯 The Pressure Index (the core). A single 0–100 reading, 0 = fully oversold, 100 = fully overbought, built from five symmetric components so no one input can run the show:
Persistence — distance-weighted time price has spent above or below the frozen center across the measurement window, not a binary count.
Displacement — how far the current close sits from the center, in ATR units.
Velocity — the z-scored rate of change, so a genuine momentum burst reads differently from a drift.
Range — where price sits inside its own recent high/low channel.
Flow — volume-weighted close location, the effort behind the move, dropped automatically on symbols without volume.
The blend is regime-aware: when short-term volatility outruns long-term, the whole ladder widens so a volatile market is not flagged as exhausted on every candle, and tightens again when things go quiet.
⭐ Strength Score (0–10). Every zone entry is graded before its label is drawn, from tier depth, how far past the threshold the Pressure Index is, the volume climax on the bar, and the velocity burst behind it. A plain Tier-1 tap and an extreme Tier-3 thrust on a volume spike are not the same event, and the score, the star rating and the label opacity all say so. One input, Min Signal Strength, is the single gate: lower it for more signals off weaker zones, raise it to see only the strong ones.
📡 Signals on every tier, not once a cycle. A signal fires on the first confirmed close inside each tier, per side, per step. As price pushes deeper, Tier 1, then Tier 2, then Tier 3 can each fire in turn, so a strong thrust is tracked the whole way out instead of giving one early flag and going quiet. Wicks never trigger a signal; only a confirmed close does. Pressure gating is optional, off by default, so the zones themselves carry the signal and nothing worth marking is filtered away.
📊 The Ladder Matrix That Shows Its Record. Six tiers sit in the dashboard, three above price and three below, split by a live PRICE row dropped exactly where price is trading. Each tier reports HIT% — the share of completed steps in which a wick reached it — and WIN% — how often a signal from that tier resolved in your favor — alongside its edge price, its distance from price in ATR, a reach gauge, and a ✓ if it was touched this step. Hot tiers are flagged. The read is instant: how rare is this level, and how has price behaved the last time it got here.
🔬 Honest Outcome Model. Every signal is a mean-reversion thesis with a symmetric R-model, and the baseline is deliberately fair. The target sits a set number of ladder units back toward the frozen center; the invalidation sits the same distance beyond. Because the two are symmetric, a coin flip scores 50%, so a WIN% above 50 on your chart is real edge, not an artifact of a target that was easier to hit than the stop. A same-bar tie where price touches both is booked as a loss, never a win. A signal that hits neither inside the max-hold window is booked as a timeout and still counted. On top of that, center-reach is tracked separately: did price make it all the way back to fair value, not just to the target.
🧪 Nothing is hidden. Every resolved signal is counted in the statistics and keeps its marker on the chart: ✓ REV for a target hit, ✕ EXT for an invalidation, ◦ END for a timeout. Losers are never dropped to flatter the win rate, same-bar ambiguity is always resolved against the signal, and timeouts are shown rather than swept away. The Signal Analytics panel reports, by tier and by side and by strength bucket: count, WIN%, center-reach rate, average bars to target, average MFE/MAE in ladder units, the full exit mix, net units, profit factor, max drawdown, expectancy and the current streak.
📈 Step Statistics. Booked only when a step completes, so the live step never inflates the rates: how often each tier is reached on the upper and lower ladders, how often both ladders are touched in one step (the two-way days), how often a step stays quiet, the average excursion from the center in ladder units, and a Calibration verdict that tells you, in plain words, to widen or tighten the Ladder Scale once enough steps are in. The ladder tunes itself to your market from your market's own behavior.
🛰️ MTF Pressure. The Pressure Index for the chart timeframe plus the three higher timeframes above it, each read non-repainting from the last closed higher-timeframe bar, each with its own gauge, value, change since its previous bar, state and ladder tier. A confluence line calls it when the stack agrees: the strongest reversion setups are the ones where the stretch shows up on more than one timeframe at once.
🏛️ Level Hierarchy. The frozen step center is the anchor, the reversion target of every signal. Tier 1 is the first stretch from it, Tier 2 and Tier 3 the progressive extremes, each a fixed ATR thickness scaled by the regime and the step length. Every tier carries its own history rather than being lumped into one overbought/oversold blob.
🎨 Neon On Black, Built To Read. The ladder is a clean stepped staircase: soft tints nearest price, deep saturated neon at the outer tiers. A tier recolors in place the instant it goes hot, no second object stacked on top. Three palettes (Violet/Green, Magenta/Cyan, Amber/Ice) plus a fully custom pair, optional neon borders, tier tags on the live step, optional rejection-wick markers, and an optional step-center line. Signal labels carry the tier, the stars and the score in plain sight.
🔔 Native Alerts. Overbought and oversold signals on any tier, Tier-2-plus signals, extreme signals, pressure crossing into overbought or oversold, Tier-3 wick touches on either side, rejection wicks, a signal reaching its target, a signal being invalidated, pressure leaving a zone, and multi-timeframe overbought/oversold confluence. Every alert names the symbol, the timeframe and the event.
🎯 Why this is different. A fixed oscillator flags the same level in every regime and repaints when the regime turns. This one rebuilds the overbought/oversold map on every step from the volatility actually present, grades each stretch five ways, keeps a fair symmetric record so the win rate means something, shows how often each tier is even reached, tells you when the ladder needs retuning, and counts every signal honestly so the numbers are ones you could have traded.
🚀 Built to adapt. The step anchor (auto higher-timeframe, a custom timeframe, or a fixed bar count), the ladder distances and thickness, the Pressure Index weights and thresholds, the signal gate and the outcome model are all inputs, so it fits FX, metals, indices, crypto or stocks on any timeframe.
💡 Cleanest setup: leave the step anchor on Auto HTF so the ladder re-anchors on a sensible higher timeframe, leave Min Signal Strength at its default for a full signal stream, and let the Step Statistics panel run for a few hundred bars. When the Calibration line reads CALIBRATED you are tuned to the market; when it says tight or wide, nudge the Ladder Scale once and let it settle.
🎯 How To Trade It: Two Approaches
Everything comes down to one question: when price stretches into these zones, does it tend to snap back to fair value or keep extending, and is the stretch in front of you strong enough to lean on?
⚡ 1) Fade the stretch: reversion to the center
Use this on an overbought or oversold signal, taken against the direction of the stretch.
▪️Read the record. You want a score of ★★★ or more, a tier with a healthy WIN% in the matrix, a volume climax on the bar, and ideally multi-timeframe confluence so the stretch is not just a one-timeframe blip.
Trigger: the confirmed tier-entry signal (OS to fade an oversold stretch long, OB to fade an overbought stretch short).
Target: the frozen step center, the reversion target drawn on every signal.
Stop: beyond the next tier edge, the invalidation level drawn on the signal.
Invalidation: a close through that next edge. The stretch extended instead of snapping back, so stand aside.
🧱 2) Respect the extension: when the stretch keeps going
Use the ladder as a map, not every tier as a fade.
▪️Read the record. If the matrix shows a low WIN% from the tier in front of you and price is pushing through tiers with a strong Pressure Index and volume behind it, the market is trending, not reverting. The deeper-tier signals are telling you the move has legs.
Trigger: successive tiers lighting up in the same direction with the Pressure Index pinned and MTF agreeing.
Read: treat the tiers as trailing checkpoints, not reversal points. Wait for a rejection wick or a Pressure Index roll-over before fading.
Watch: the first tier that fails to hold on a close back inside. That is where a trending stretch finally starts to revert.
✋ Stand down: when the dashboard says wait
A live strength below your minimum, or price sitting in the channel between the ladders with no tier entry.
A two-way step where both ladders have already been touched: the step is chopping, not stretching.
Too few tracked steps to trust the hit rates, or the Calibration line still reading "collecting."
A WIN% near 50 on the tier in front of you: this market is not reverting cleanly from here, so the edge is thin.
Price mid-channel with no signal: wait for the close into a tier and let the alert bring you in.
Rule of thumb: ⚡ Deep tier + high score + strong tier WIN% + MTF confluence → fade the stretch back toward the center. 🧱 Tiers stacking in one direction + low reversion WIN% + Pressure pinned → respect the trend, use the ladder as a trail, wait for rejection. ❄️ Low score, both ladders touched, thin sample or an uncalibrated ladder → stand down until the step shows its hand.
▪️Honest statistics. This is a measurement and analysis tool, not a signal service and not a promise that any stretch will revert or extend. The outcome model is symmetric, so a coin flip scores 50% and only a WIN% above that is edge. Every signal is counted, none are dropped for losing, same-bar ties are booked against the signal, timeouts are shown not hidden, and step rates exclude the live step so nothing is flattered. The probabilities are the historical frequencies of this ladder on this market in the bars the indicator can see. They describe how price has behaved when it reached these zones, not how it must behave next. Outcomes are recorded on confirmed closes and a live signal can still change until its bar closes.

Gold Algo Trading · +1100% YTD · max DD <5%
Syndicate Ultimate · 5 algo systems · 1 bundle
1 payment · lifetime access · no monthly fees
+ FX · NQ/ES · 10+ yr institutional desk
syndicate001.com
Join on Telegram
t.me/aisyndicate001
Syndicate Ultimate · 5 algo systems · 1 bundle
1 payment · lifetime access · no monthly fees
+ FX · NQ/ES · 10+ yr institutional desk
syndicate001.com
Join on Telegram
t.me/aisyndicate001
כתב ויתור
המידע והפרסומים אינם מיועדים להיות, ואינם מהווים, ייעוץ או המלצה פיננסית, השקעתית, מסחרית או מכל סוג אחר המסופקת או מאושרת על ידי TradingView. קרא עוד ב־תנאי השימוש.
Gold Algo Trading · +1100% YTD · max DD <5%
Syndicate Ultimate · 5 algo systems · 1 bundle
1 payment · lifetime access · no monthly fees
+ FX · NQ/ES · 10+ yr institutional desk
syndicate001.com
Join on Telegram
t.me/aisyndicate001
Syndicate Ultimate · 5 algo systems · 1 bundle
1 payment · lifetime access · no monthly fees
+ FX · NQ/ES · 10+ yr institutional desk
syndicate001.com
Join on Telegram
t.me/aisyndicate001
כתב ויתור
המידע והפרסומים אינם מיועדים להיות, ואינם מהווים, ייעוץ או המלצה פיננסית, השקעתית, מסחרית או מכל סוג אחר המסופקת או מאושרת על ידי TradingView. קרא עוד ב־תנאי השימוש.