OPEN-SOURCE SCRIPT
מעודכן SMT Divergence | Multi-Index Liquidity Comparison
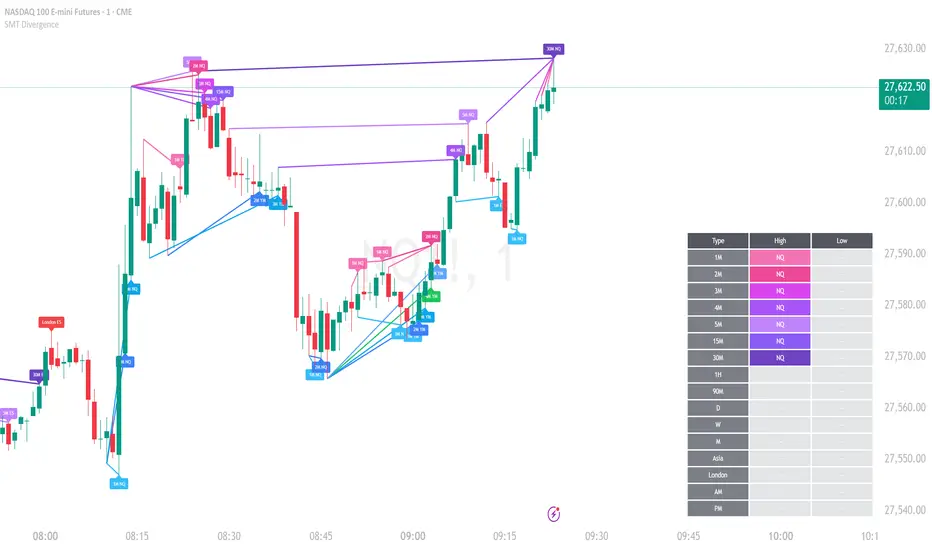
SMT Divergence Map | Multi-Index Liquidity Comparison
Description:
Overview
This indicator tracks structural divergence between correlated index futures by comparing relative highs and lows across multiple markets. It is designed as a market-structure mapping tool, not as a standalone trade signal. The goal is to make intermarket disagreement visible so the user can judge whether one market is confirming or failing to confirm the movement of another.
What the script plots
The script compares selected symbols such as NQ, ES, and YM and highlights divergence when one market takes a corresponding high or low while another does not. It can monitor multiple timeframes and can also project selected higher-timeframe reference levels onto the active chart so the user can evaluate divergence in context.
How the logic works
The script reads highs and lows from 7 lookback bars of the selected symbols over the chosen comparison windows to the current market price. A bearish-style divergence is identified when one market trades above a prior reference high while another correlated market fails to do the same. A bullish-style divergence is identified when one market trades below a prior reference low while another correlated market fails to confirm that low. The script then plots the relevant divergence markers and optional reference lines on the chart.
Inputs and customization
Users can choose which symbols to compare, which timeframes to evaluate, which divergence types to display, and whether to show supporting structures such as prior highs/lows, session references, daily references, or higher-timeframe range levels. Visual controls allow the user to adjust labels, line styles, colors, table size & transparency customization and display density.
How to use it
This tool is best used as a structural context layer. It helps identify areas where correlated markets stop agreeing, which may matter near liquidity sweeps, session extremes, or higher-timeframe reference levels. The script does not place orders and does not guarantee reversal or continuation. It simply visualizes divergence so the trader can combine it with their own execution framework.
Originality / why this script exists
This publication consolidates multiple SMT comparison functions into one configurable tool so users do not need several overlapping variants. The purpose is not to merge indicators for the sake of a mashup, but to provide one organized framework for viewing intermarket divergence, session references, and higher-timeframe structure in a single workflow.
Limitations
Divergence is contextual and does not automatically imply a successful trade. Different data feeds, symbol mappings, session settings, and timeframes can change what is displayed. Users should verify the symbol configuration and session definitions before relying on the output.
Note
This is a charting and analysis tool. It does not make performance claims, does not predict future results, and should be used as one component of a broader decision process.
הערות שחרור
New Feature Updates1. Expanded Timeframe Support
To cater to scalpers and high-frequency traders, we have integrated new lower-level timeframes. You can now track SMT across:
1m, 2m, 3m, 4m, and 5m intervals.
This allows for much tighter entries and faster identification of intraday shifts in momentum.
2. Instant Invalidation (Zero-Lag Removal)
In previous private versions, SMT lines often lingered on the chart after the price action had invalidated the setup, causing visual clutter.
The Fix: SMT lines now remove themselves instantly the moment a value is invalidated.
Benefit: Your chart remains clean, showing only active, valid setups in real-time.
3. Isolated "Look-Back" Logic
We have fixed a bug regarding how SMT lines are drawn relative to historical bars.
Old Way: The indicator would sometimes draw lines across all prior bars leading up to the signal.
New Way: If an SMT is identified at Look-Back Bar #5, the indicator will only render the line from the specific High/Low of that bar to the current price.
Result: It no longer highlights irrelevant prior bars (1, 2, 3, or 4), ensuring you are only looking at the specific candle that triggered the divergence.
4. Advanced Visual Customization
You now have total control over the aesthetics and positioning of your SMT data:
Tagline Placement: Choose exactly where the SMT text labels appear. You can now toggle text alignment to the Right, Middle, or Left of the signal lines.
Dynamic Table Positioning: Previously, the SMT info table was fixed in one spot. You can now manually adjust the Table Location to any corner of your chart to ensure it doesn't overlap with your price action or other indicators.
Note: These updates are designed to bridge the gap between technical analysis and a clean trading environment. Ensure you refresh your indicator settings to see the new customization options in your dashboard.
הערות שחרור
The SMT indicator has been significantly optimized, accuracy, and chart stability. The script now uses a lighter configurable multi-timeframe structure instead of hardcoding every timeframe, reducing memory pressure and request overload issues. SMT lines are now anchored to the actual high or low of the current open candle on the selected timeframe, not the live market price, so the drawings remain structurally accurate.The logic was also refined so each valid SMT reference is handled individually. The indicator no longer plots lines to every prior candle just because one lookback candle is valid. Intermediate sweeps now invalidate only the affected reference candle, which improves precision and removes invalid SMT conditions much faster. Lines and labels are anchored with time-based placement, preventing floating or chart-drift issues when scrolling or changing the view.
Overall, the update delivers cleaner SMT detection, better multi-timeframe usability, lower script load, and more reliable visual anchoring across supported chart timeframes.
סקריפט קוד פתוח
ברוח האמיתית של TradingView, יוצר הסקריפט הזה הפך אותו לקוד פתוח, כך שסוחרים יוכלו לעיין בו ולאמת את פעולתו. כל הכבוד למחבר! אמנם ניתן להשתמש בו בחינם, אך זכור כי פרסום חוזר של הקוד כפוף ל־כללי הבית שלנו.

כתב ויתור
המידע והפרסומים אינם מיועדים להיות, ואינם מהווים, ייעוץ או המלצה פיננסית, השקעתית, מסחרית או מכל סוג אחר המסופקת או מאושרת על ידי TradingView. קרא עוד ב־תנאי השימוש.
סקריפט קוד פתוח
ברוח האמיתית של TradingView, יוצר הסקריפט הזה הפך אותו לקוד פתוח, כך שסוחרים יוכלו לעיין בו ולאמת את פעולתו. כל הכבוד למחבר! אמנם ניתן להשתמש בו בחינם, אך זכור כי פרסום חוזר של הקוד כפוף ל־כללי הבית שלנו.
כתב ויתור
המידע והפרסומים אינם מיועדים להיות, ואינם מהווים, ייעוץ או המלצה פיננסית, השקעתית, מסחרית או מכל סוג אחר המסופקת או מאושרת על ידי TradingView. קרא עוד ב־תנאי השימוש.