Blue Sky Breakout Momentum
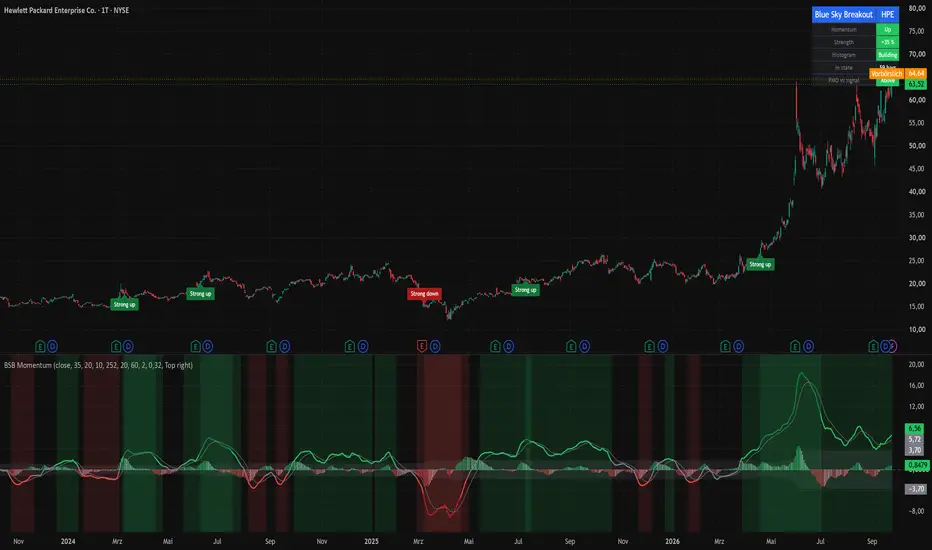
A momentum reading in five plain words: Strong up, Up, Flat, Down, Strong down. Next to it a strength figure from -100 % to +100 %, a histogram that tells you whether the move is building or fading, and a small table on the chart. Every colour is a measured past, never a forecast. The script gives no advice: no entries, no exits, no targets.
WHAT IT DOES
The panel answers one question: does this chart have momentum right now, and how much? It measures, it does not predict. The candles take the colour of the current state, so the answer is visible without reading the panel.
HOW IT WORKS
Core: the Price Momentum Oscillator (PMO), a rate of change smoothed twice (35 and 20 bars) with a 10 bar EMA signal line. The PMO is taken from the public TradingView "ta" library. Because it is built on a rate of change it is price relative and reads the same on a 5 dollar stock and a 500 dollar stock.
Strength: the PMO divided by its own largest absolute value of the last 252 bars, shown as a percentage. 100 % means "as strong as it has been in the past year", 10 % means a small move by this symbol's own standards. This is what makes the reading comparable from one symbol to the next.
State: below 20 % strength the chart is Flat, a grey zone around zero. Above that it is Up or Down. From 60 % it is Strong up or Strong down. A new state counts only after it has held for two bars, so one bar flickers do not change the reading.
Histogram: PMO minus its signal line. A deep tone while the gap widens in the direction of the state (building), a light tone while it narrows (fading). This separates "momentum that is still growing" from "momentum that is running out".
Table: Momentum (the state), Strength (the percentage), Histogram (Building or Fading), In state (how many bars the state has held) and PMO vs signal (Above or Below).
HOW TO USE IT
Read the table from top to bottom. Momentum gives the state, Strength the size, Histogram whether it is still building, In state for how long. The coloured background of the panel and the candle colours repeat the state. A label marks the candle where a strong state began, so you can see at a glance how far the current move has already come. Nothing in this script is a signal to buy or sell.
SETTINGS
Momentum: source, the two PMO smoothing lengths, the signal length and the window for the strength scale (252 daily bars is one year).
State: the Flat threshold (default 20 %), the Strong threshold (default 60 %) and how many bars a state must hold before it counts (default 2).
Pane: histogram, signal line, flat zone and coloured background on or off, background strength.
Chart: candle colouring, strong state markers, table on or off and table position.
ALERTS
Five alerts, all on measured changes only: PMO crossed above zero, PMO crossed below zero, momentum turned strong up, momentum turned strong down, strong momentum ended.
WHY IT IS ORIGINAL
The PMO itself is a standard oscillator. What this script adds is the year relative strength scale that makes momentum comparable across symbols, the five state wording with a hold rule, the building or fading tone on the histogram, and the plain table that puts all of it into words. The combination exists so that one look answers "is there momentum, how much, and is it still growing" without interpreting a line chart. The idea of grading momentum against its recent range was inspired by the open-source "Momentum Shift" by BigBeluga, the four tone histogram by the open-source "Momentum Ghost Machine" by ChartPrime. No code from either script is used.
LIMITATIONS
Momentum is measured from closed bars and lags the price by design. Strength is relative to the last year: after a quiet year an ordinary move can read as strong, after a wild year a decent move can read as weak. On symbols with fewer than 252 bars of history the scale uses whatever history exists. The state hold rule delays every state change by the chosen number of bars. This script works on any symbol and any timeframe, but the default lengths were chosen for daily charts of stocks.
Trading stocks can cost you everything you put in. This script is a measurement, not advice.
WHAT IT DOES
The panel answers one question: does this chart have momentum right now, and how much? It measures, it does not predict. The candles take the colour of the current state, so the answer is visible without reading the panel.
HOW IT WORKS
Core: the Price Momentum Oscillator (PMO), a rate of change smoothed twice (35 and 20 bars) with a 10 bar EMA signal line. The PMO is taken from the public TradingView "ta" library. Because it is built on a rate of change it is price relative and reads the same on a 5 dollar stock and a 500 dollar stock.
Strength: the PMO divided by its own largest absolute value of the last 252 bars, shown as a percentage. 100 % means "as strong as it has been in the past year", 10 % means a small move by this symbol's own standards. This is what makes the reading comparable from one symbol to the next.
State: below 20 % strength the chart is Flat, a grey zone around zero. Above that it is Up or Down. From 60 % it is Strong up or Strong down. A new state counts only after it has held for two bars, so one bar flickers do not change the reading.
Histogram: PMO minus its signal line. A deep tone while the gap widens in the direction of the state (building), a light tone while it narrows (fading). This separates "momentum that is still growing" from "momentum that is running out".
Table: Momentum (the state), Strength (the percentage), Histogram (Building or Fading), In state (how many bars the state has held) and PMO vs signal (Above or Below).
HOW TO USE IT
Read the table from top to bottom. Momentum gives the state, Strength the size, Histogram whether it is still building, In state for how long. The coloured background of the panel and the candle colours repeat the state. A label marks the candle where a strong state began, so you can see at a glance how far the current move has already come. Nothing in this script is a signal to buy or sell.
SETTINGS
Momentum: source, the two PMO smoothing lengths, the signal length and the window for the strength scale (252 daily bars is one year).
State: the Flat threshold (default 20 %), the Strong threshold (default 60 %) and how many bars a state must hold before it counts (default 2).
Pane: histogram, signal line, flat zone and coloured background on or off, background strength.
Chart: candle colouring, strong state markers, table on or off and table position.
ALERTS
Five alerts, all on measured changes only: PMO crossed above zero, PMO crossed below zero, momentum turned strong up, momentum turned strong down, strong momentum ended.
WHY IT IS ORIGINAL
The PMO itself is a standard oscillator. What this script adds is the year relative strength scale that makes momentum comparable across symbols, the five state wording with a hold rule, the building or fading tone on the histogram, and the plain table that puts all of it into words. The combination exists so that one look answers "is there momentum, how much, and is it still growing" without interpreting a line chart. The idea of grading momentum against its recent range was inspired by the open-source "Momentum Shift" by BigBeluga, the four tone histogram by the open-source "Momentum Ghost Machine" by ChartPrime. No code from either script is used.
LIMITATIONS
Momentum is measured from closed bars and lags the price by design. Strength is relative to the last year: after a quiet year an ordinary move can read as strong, after a wild year a decent move can read as weak. On symbols with fewer than 252 bars of history the scale uses whatever history exists. The state hold rule delays every state change by the chosen number of bars. This script works on any symbol and any timeframe, but the default lengths were chosen for daily charts of stocks.
Trading stocks can cost you everything you put in. This script is a measurement, not advice.

כתב ויתור
המידע והפרסומים אינם מיועדים להיות, ואינם מהווים, ייעוץ או המלצה פיננסית, השקעתית, מסחרית או מכל סוג אחר המסופקת או מאושרת על ידי TradingView. קרא עוד ב־תנאי השימוש.
כתב ויתור
המידע והפרסומים אינם מיועדים להיות, ואינם מהווים, ייעוץ או המלצה פיננסית, השקעתית, מסחרית או מכל סוג אחר המסופקת או מאושרת על ידי TradingView. קרא עוד ב־תנאי השימוש.