Ultimate ORB & Momentum Dashboard v7.5
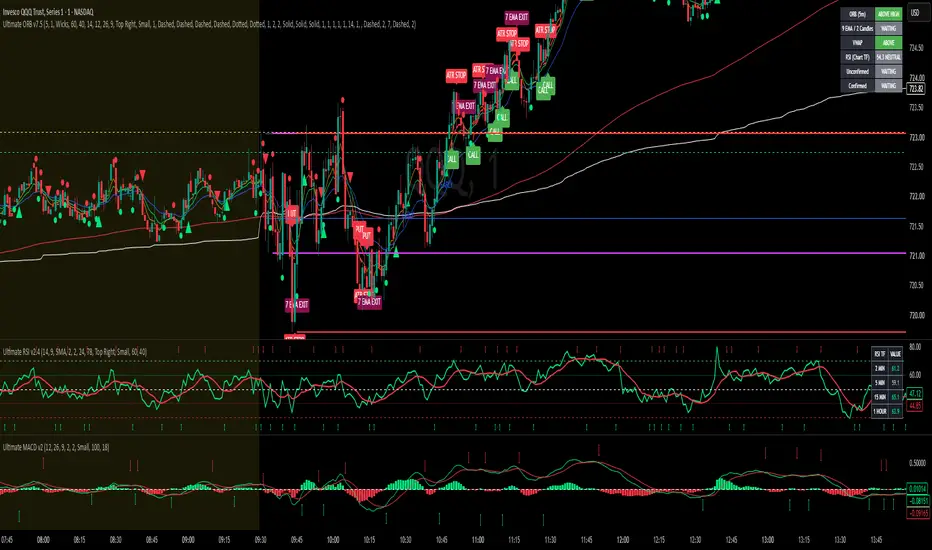
# ULTIMATE ORB & MOMENTUM DASHBOARD v7.5
## Complete Trading Guide and Symbol Legend
### PURPOSE OF THIS INDICATOR
The Ultimate ORB & Momentum Dashboard is your primary TradingView indicator.
It is designed to help identify bullish CALL and bearish PUT opportunities using opening range breakouts, moving averages, VWAP, and RSI.
It also provides early momentum warnings, important support and resistance levels, and two independent methods for managing exits.
The indicator has five main functions:
1. Establish the opening range after the stock market opens.
2. Identify early bullish or bearish momentum.
3. Confirm CALL and PUT setups using four mandatory conditions.
4. Display moving averages and important price levels.
5. Provide ATR trailing-stop and 7 EMA exit signals.
**IMPORTANT:** A confirmed signal means all programmed entry conditions agree. It does not guarantee a profitable trade or automatically place an order.
---
## SECTION 1 — OPENING RANGE BREAKOUT (ORB)
### What is an opening range?
The opening range is the highest and lowest price reached during a specified period immediately after the regular U.S. stock market opens at 9:30 AM Eastern.
This range helps identify the initial buying and selling pressure of the trading session.
Your indicator displays three independently adjustable opening ranges.
### ORB COLOR LEGEND
🔵 **BLUE THIN SOLID — 2-MINUTE ORB**
- Begins at 9:30 AM Eastern.
- Ends at 9:32 AM Eastern.
- Establishes the first two minutes' high and low.
- Reacts to very early market movement.
- May produce more frequent breakouts and false signals.
🟣 **MAGENTA SOLID — 5-MINUTE ORB**
- Begins at 9:30 AM Eastern.
- Ends at 9:35 AM Eastern.
- Establishes the first five minutes' high and low.
- Your default ORB for confirming trades.
- Provides more opening price information than the 2-minute ORB.
🔴 **RED SOLID — 15-MINUTE ORB**
- Begins at 9:30 AM Eastern.
- Ends at 9:45 AM Eastern.
- Establishes the first fifteen minutes' high and low.
- Often creates a wider opening range.
- May produce fewer but later breakout opportunities.
### How to use the ORB
Imagine a stock opens at 9:30 AM.
At 9:35 AM, its completed 5-minute opening range is:
- ORB High: $250.00
- ORB Low: $248.00
A bullish breakout occurs when price moves above $250.00.
A bearish breakout occurs when price moves below $248.00.
However, your indicator does not confirm a trade simply because price touches or briefly moves beyond the ORB.
**It requires two consecutive qualifying candle closes beyond the selected ORB boundary.**
For a CALL, both closes must be above the ORB high.
For a PUT, both closes must be below the ORB low.
The breakout confirmation is designed around selectable 1-minute or 2-minute candles.
The ORB itself can be calculated using either full candle wicks or candle bodies, depending on your settings.
### Which ORB should you use?
**2-minute:** Useful for studying very early breakouts, but more sensitive to opening volatility.
**5-minute:** Your default and a reasonable starting point for your strategy.
**15-minute:** Useful when you want to observe more of the opening price action before confirming a breakout.
You can display all three while using only one for confirmation.
---
## SECTION 2 — MOVING AVERAGES AND VWAP
Your indicator includes five important price overlays.
### MOVING AVERAGE COLOR LEGEND
🟠 **ORANGE SOLID — 5 EMA**
The 5 EMA is a fast exponential moving average.
It follows recent price changes closely and helps you observe immediate momentum.
For a CALL, price staying above the 5 EMA may indicate continued short-term strength.
For a PUT, price staying below it may indicate continued short-term weakness.
A candle closing across the 5 EMA can be an early warning of weakening momentum.
The 5 EMA is not required for confirmed CALL or PUT signals.
🟢 **GREEN SOLID — 9 EMA**
The 9 EMA is one of your four mandatory trade-confirmation conditions.
For a confirmed CALL, two consecutive qualifying candles must close above the 9 EMA.
For a confirmed PUT, two consecutive qualifying candles must close below the 9 EMA.
This helps prevent confirming a breakout while price is still trading against short-term momentum.
🔵 **BLUE SOLID — 20 EMA**
The 20 EMA helps identify the short-term trend.
When the 9 EMA is above the 20 EMA, shorter-term momentum may be bullish.
When the 9 EMA is below the 20 EMA, shorter-term momentum may be bearish.
Your indicator displays special triangles when the 9 EMA crosses the 20 EMA.
The 20 EMA is not a mandatory confirmed-trade condition.
🔴 **RED SOLID — 200 EMA**
The 200 EMA provides a longer-term trend reference.
Price above the 200 EMA can suggest a stronger bullish background.
Price below the 200 EMA can suggest a stronger bearish background.
The 200 EMA can also act as an area of potential support or resistance.
It does not determine confirmed CALL or PUT signals.
⚪ **WHITE SOLID — VWAP**
VWAP stands for Volume Weighted Average Price.
It represents an average price weighted by trading volume during the session.
VWAP is one of your four mandatory confirmation rules.
- Confirmed CALL: Price must close above VWAP.
- Confirmed PUT: Price must close below VWAP.
VWAP helps you recognize whether price is trading above or below the session's volume-weighted average.
---
## SECTION 3 — CONFIRMED CALL SIGNALS
### What creates a confirmed CALL?
A confirmed CALL requires **all four conditions**:
**RULE 1 — ORB BREAKOUT**
Two consecutive qualifying candles close above the selected ORB high.
**RULE 2 — 9 EMA CONFIRMATION**
Two consecutive qualifying candles close above the 9 EMA.
**RULE 3 — VWAP CONFIRMATION**
Price closes above VWAP.
**RULE 4 — RSI CONFIRMATION**
RSI(14) on the current chart timeframe is at least 60.
### Example of a confirmed CALL
Suppose:
- The 5-minute ORB high is $250.00.
- Two qualifying candles close at $250.15 and $250.30.
- Both candles close above the 9 EMA.
- Price is above VWAP.
- RSI reads 64.
All four conditions agree.
The indicator can display:
🟢 **CALL — CONFIRMED**
### What does the CALL label mean?
It means the indicator has identified a bullish setup according to your rules.
It does not mean the price will continue rising or that a CALL option is guaranteed to gain value.
Before acting, consider nearby resistance, the stop distance, potential reward, and option-specific risks.
---
## SECTION 4 — CONFIRMED PUT SIGNALS
A confirmed PUT requires **all four opposite conditions**.
**RULE 1 — ORB BREAKDOWN**
Two consecutive qualifying candles close below the selected ORB low.
**RULE 2 — 9 EMA CONFIRMATION**
Two consecutive qualifying candles close below the 9 EMA.
**RULE 3 — VWAP CONFIRMATION**
Price closes below VWAP.
**RULE 4 — RSI CONFIRMATION**
RSI(14) on the current chart timeframe is 40 or lower.
### Example of a confirmed PUT
Suppose:
- The 5-minute ORB low is $248.00.
- Two qualifying candles close at $247.85 and $247.60.
- Both candles close below the 9 EMA.
- Price is below VWAP.
- RSI reads 36.
All four conditions agree.
The indicator can display:
🔴 **PUT — CONFIRMED**
### Important confirmation rule
**MACD is NOT required for confirmed CALL or PUT signals.**
Your confirmed-trade rules are ORB, 9 EMA, VWAP, and RSI only.
---
## SECTION 5 — EARLY CALL AND PUT SIGNALS
Early signals identify momentum that may develop into a breakout.
They are not confirmed trades.
### EARLY CALL REQUIREMENTS
- MACD is above its signal line.
- RSI is 60 or higher.
- Price closes above the 9 EMA.
- VWAP agreement is not required.
- An ORB breakout is not required.
🟢 **EARLY CALL** indicates bullish momentum may be developing.
### EARLY PUT REQUIREMENTS
- MACD is below its signal line.
- RSI is 40 or lower.
- Price closes below the 9 EMA.
- VWAP agreement is not required.
- An ORB breakout is not required.
🔴 **EARLY PUT** indicates bearish momentum may be developing.
### How to use early signals
An early signal is a reason to watch the chart more closely.
For example, an EARLY CALL appears while price is still inside the opening range.
You can then watch whether price breaks the ORB high and completes the remaining confirmation conditions.
Early signals are designed to appear after the selected opening range has formed, while price is still within that range.
**Do not confuse EARLY with CONFIRMED.**
---
## SECTION 6 — CHART SYMBOL LEGEND
🟢 **GREEN DOT — PRICE CROSSES ABOVE 9 EMA**
A candle crosses and closes above the 9 EMA.
This suggests improving short-term bullish momentum.
It is not a confirmed CALL.
🔴 **RED DOT — PRICE CROSSES BELOW 9 EMA**
A candle crosses and closes below the 9 EMA.
This suggests weakening short-term momentum or increasing bearish pressure.
It is not a confirmed PUT.
🟢 **GREEN UPWARD TRIANGLE — 9 EMA CROSSES ABOVE 20 EMA**
This is a bullish moving-average crossover.
It may indicate improving trend direction.
It is not a confirmed CALL.
🔴 **RED DOWNWARD TRIANGLE — 9 EMA CROSSES BELOW 20 EMA**
This is a bearish moving-average crossover.
It may indicate weakening trend direction.
It is not a confirmed PUT.
🟢 **EARLY CALL MARKER**
Bullish momentum conditions are satisfied, but the full confirmation requirements are not.
🔴 **EARLY PUT MARKER**
Bearish momentum conditions are satisfied, but the full confirmation requirements are not.
🟢 **CALL LABEL**
All four confirmed bullish conditions agree.
🔴 **PUT LABEL**
All four confirmed bearish conditions agree.
❌ **ATR STOP**
The ATR trailing-stop condition has been triggered.
❌ **7 EMA EXIT**
The 7 EMA exit condition has been triggered.
Stop-loss and exit labels can be hidden in the indicator settings without hiding the plotted stop lines.
---
## SECTION 7 — SUPPORT AND RESISTANCE LINE LEGEND
These lines mark important historical price levels.
🟡 **YELLOW DASHED — PREMARKET HIGH**
The highest price reached during the premarket session.
🟡 **YELLOW DASHED — PREMARKET LOW**
The lowest price reached during the premarket session.
🟢 **GREEN DASHED — PREVIOUS DAY HIGH**
The highest price of the previous trading day.
🔴 **RED DASHED — PREVIOUS DAY LOW**
The lowest price of the previous trading day.
🟢 **GREEN DOTTED — PREVIOUS WEEK HIGH**
The highest price of the previous trading week.
🔴 **RED DOTTED — PREVIOUS WEEK LOW**
The lowest price of the previous trading week.
### How to use these levels
These areas may act as support, resistance, breakout points, or reversal areas.
For example, a confirmed CALL appearing directly beneath the previous-day high may face nearby resistance.
A confirmed PUT appearing directly above the previous-day low may encounter support.
These reference levels are not mandatory confirmation conditions.
---
## SECTION 8 — ATR TRAILING STOP
### What is ATR?
ATR stands for Average True Range.
It measures price volatility.
ATR helps estimate how much price has recently been moving, rather than using a fixed number of cents or dollars for every trade.
### Default ATR settings
- ATR trailing stop: Enabled
- ATR length: 14
- ATR multiplier: 1.0
- ATR timeframe: Current chart
- Color: Red
- Style: Dashed
- Width: Adjustable
### How the ATR trailing stop works
For a CALL, the trailing stop moves upward when price makes favorable progress.
It does not move downward when price pulls back.
For a PUT, the trailing stop moves downward when price makes favorable progress.
It does not move upward when price rebounds.
This is called a ratcheting stop.
### Adjusting the ATR multiplier
**0.5× ATR — Very tight**
- Stop remains relatively close to price.
- Can trigger quickly.
- May exit during ordinary market fluctuations.
**0.8× ATR — Tight**
- Allows slightly more movement.
- May appeal to traders who prefer fast exits.
**1.0× ATR — Your default**
- A starting point for comparing a volatility-based exit with your usual moving-average exits.
**1.5× ATR — Looser**
- Allows larger price fluctuations.
- May help avoid some premature exits.
- Can give back more profit.
**2.0× ATR — Wide**
- Gives the trade substantially more room.
- May be more suitable for stronger trends.
- Can result in a larger loss or greater profit giveback.
### Is ATR timeframe-sensitive?
Yes.
ATR(14) on a 1-minute chart measures volatility across fourteen 1-minute candles.
ATR(14) on a 5-minute chart measures volatility across fourteen 5-minute candles.
These are different measurements.
Your indicator allows the ATR timeframe to be adjusted.
The ATR stop is a visual calculation and alert mechanism. It does not automatically place a brokerage stop-loss order.
---
## SECTION 9 — 7 EMA EXIT STRATEGY
The 7 EMA is a separate exit method.
It was selected because it reacts more slowly than the 5 EMA but more quickly than the 9 EMA.
### Default appearance
🔴 **RED DASHED — 7 EMA EXIT LINE**
- Length: 7
- Color: Red
- Style: Dashed
- Width: Adjustable
- Visibility: Adjustable
### CALL exit rule
After a confirmed CALL, a completed candle closing below the 7 EMA triggers an EXIT CALL condition.
### PUT exit rule
After a confirmed PUT, a completed candle closing above the 7 EMA triggers an EXIT PUT condition.
### 5 EMA vs. 7 EMA vs. 9 EMA
**5 EMA:** Fastest response. May signal exits quickly.
**7 EMA:** Middle-ground response. May tolerate slightly more pullback.
**9 EMA:** Slowest of the three. Often provides more room before an EMA-based exit.
### How the 7 EMA differs from ATR
The 7 EMA follows average price and can move in either direction.
The ATR trailing stop follows a volatility-based calculation and is designed not to retreat against the trade.
You can display both simultaneously.
You should decide before entering a real trade which method controls your exit.
---
## SECTION 10 — STOP LOSS SETTINGS
The Stop Loss Settings section groups both exit strategies.
### ATR settings
- Show/hide ATR trailing stop
- ATR length
- ATR multiplier
- ATR timeframe
- Line color
- Line style
- Line width
### 7 EMA settings
- Show/hide 7 EMA exit line
- EMA length
- Line color
- Line style
- Line width
### Labels and alerts
The indicator includes optional ATR STOP and 7 EMA EXIT labels and corresponding alert conditions.
You can turn off the STOP/EXIT labels to keep your chart cleaner.
The stop lines can remain visible.
Alerts must be configured separately in TradingView.
---
## SECTION 11 — YOUR SIX-ROW DASHBOARD
The dashboard summarizes the current chart conditions.
**ROW 1 — ORB**
Indicates whether the selected ORB breakout condition supports CALL or PUT.
**ROW 2 — 9 EMA / TWO CANDLES**
Shows whether the two-candle EMA confirmation condition agrees with the trade direction.
**ROW 3 — VWAP**
Shows whether price is above or below VWAP.
**ROW 4 — RSI**
Displays the current chart timeframe RSI condition.
RSI at or above 60 supports CALL.
RSI at or below 40 supports PUT.
**ROW 5 — UNCONFIRMED CALL/PUT**
Displays early momentum conditions.
These use MACD, RSI, and EMA 9.
**ROW 6 — CONFIRMED CALL/PUT**
Displays the fully confirmed trading condition.
All four mandatory requirements must agree.
### Dashboard appearance
You can adjust:
- Visibility
- Screen position
- Text size
- Background colors
- Text colors
The dashboard is intended to make your rules easier to review without searching through every chart line.
---
## SECTION 12 — HOW TO USE THE INDICATOR EACH MORNING
**STEP 1 — BEFORE MARKET OPEN**
Identify premarket high and low, previous-day high and low, and previous-week high and low.
Observe the broader trend and nearby price levels.
**STEP 2 — AT 9:30 AM**
Allow the opening range to begin forming.
Avoid treating an unfinished ORB as a completed breakout.
**STEP 3 — AT 9:35 AM**
Your default 5-minute ORB is complete.
Identify its high and low.
**STEP 4 — WATCH FOR EARLY SIGNALS**
An EARLY CALL or EARLY PUT may appear while price remains inside the opening range.
Use this as a momentum warning.
**STEP 5 — WAIT FOR CONFIRMATION**
For CALL:
- Two qualifying closes above ORB high
- Two qualifying closes above EMA 9
- Close above VWAP
- RSI ≥ 60
For PUT:
- Two qualifying closes below ORB low
- Two qualifying closes below EMA 9
- Close below VWAP
- RSI ≤ 40
**STEP 6 — CHECK YOUR RISK**
Before entering, determine your planned stop, potential loss, position size, and nearby support or resistance.
**STEP 7 — MANAGE YOUR EXIT**
Watch your ATR trailing stop and 7 EMA exit conditions.
Follow your predetermined exit plan rather than changing methods during the trade without a reason.
**STEP 8 — REVIEW THE TRADE**
Record your entry, RSI reading, ORB level, stop distance, exit signal, and result.
Review multiple trades to determine whether your selected settings suit your market and timeframe.
---
## SECTION 13 — IMPORTANT REMINDERS
- Confirmed CALL/PUT requires ORB, EMA 9, VWAP, and RSI.
- MACD does not confirm trades.
- Early signals are not confirmed entries.
- EMA crossover dots and triangles are informational.
- ATR and 7 EMA are exit-management tools.
- Changing chart timeframes changes EMA, RSI, MACD, and ATR calculations.
- Indicator signals do not guarantee profitable trades.
- TradingView alerts do not automatically place orders.
- Option prices are also affected by implied volatility, time decay, and bid-ask spreads.
**YOUR MAIN TRADING RULE:**
Wait for the four mandatory confirmation conditions to agree, evaluate the risk, and manage the trade according to your chosen exit strategy.
This guide describes the intended v7.5 configuration. Signal timing and alert behavior should be checked against the installed Pine Script in TradingView before relying on it for live trades.
## Complete Trading Guide and Symbol Legend
### PURPOSE OF THIS INDICATOR
The Ultimate ORB & Momentum Dashboard is your primary TradingView indicator.
It is designed to help identify bullish CALL and bearish PUT opportunities using opening range breakouts, moving averages, VWAP, and RSI.
It also provides early momentum warnings, important support and resistance levels, and two independent methods for managing exits.
The indicator has five main functions:
1. Establish the opening range after the stock market opens.
2. Identify early bullish or bearish momentum.
3. Confirm CALL and PUT setups using four mandatory conditions.
4. Display moving averages and important price levels.
5. Provide ATR trailing-stop and 7 EMA exit signals.
**IMPORTANT:** A confirmed signal means all programmed entry conditions agree. It does not guarantee a profitable trade or automatically place an order.
---
## SECTION 1 — OPENING RANGE BREAKOUT (ORB)
### What is an opening range?
The opening range is the highest and lowest price reached during a specified period immediately after the regular U.S. stock market opens at 9:30 AM Eastern.
This range helps identify the initial buying and selling pressure of the trading session.
Your indicator displays three independently adjustable opening ranges.
### ORB COLOR LEGEND
🔵 **BLUE THIN SOLID — 2-MINUTE ORB**
- Begins at 9:30 AM Eastern.
- Ends at 9:32 AM Eastern.
- Establishes the first two minutes' high and low.
- Reacts to very early market movement.
- May produce more frequent breakouts and false signals.
🟣 **MAGENTA SOLID — 5-MINUTE ORB**
- Begins at 9:30 AM Eastern.
- Ends at 9:35 AM Eastern.
- Establishes the first five minutes' high and low.
- Your default ORB for confirming trades.
- Provides more opening price information than the 2-minute ORB.
🔴 **RED SOLID — 15-MINUTE ORB**
- Begins at 9:30 AM Eastern.
- Ends at 9:45 AM Eastern.
- Establishes the first fifteen minutes' high and low.
- Often creates a wider opening range.
- May produce fewer but later breakout opportunities.
### How to use the ORB
Imagine a stock opens at 9:30 AM.
At 9:35 AM, its completed 5-minute opening range is:
- ORB High: $250.00
- ORB Low: $248.00
A bullish breakout occurs when price moves above $250.00.
A bearish breakout occurs when price moves below $248.00.
However, your indicator does not confirm a trade simply because price touches or briefly moves beyond the ORB.
**It requires two consecutive qualifying candle closes beyond the selected ORB boundary.**
For a CALL, both closes must be above the ORB high.
For a PUT, both closes must be below the ORB low.
The breakout confirmation is designed around selectable 1-minute or 2-minute candles.
The ORB itself can be calculated using either full candle wicks or candle bodies, depending on your settings.
### Which ORB should you use?
**2-minute:** Useful for studying very early breakouts, but more sensitive to opening volatility.
**5-minute:** Your default and a reasonable starting point for your strategy.
**15-minute:** Useful when you want to observe more of the opening price action before confirming a breakout.
You can display all three while using only one for confirmation.
---
## SECTION 2 — MOVING AVERAGES AND VWAP
Your indicator includes five important price overlays.
### MOVING AVERAGE COLOR LEGEND
🟠 **ORANGE SOLID — 5 EMA**
The 5 EMA is a fast exponential moving average.
It follows recent price changes closely and helps you observe immediate momentum.
For a CALL, price staying above the 5 EMA may indicate continued short-term strength.
For a PUT, price staying below it may indicate continued short-term weakness.
A candle closing across the 5 EMA can be an early warning of weakening momentum.
The 5 EMA is not required for confirmed CALL or PUT signals.
🟢 **GREEN SOLID — 9 EMA**
The 9 EMA is one of your four mandatory trade-confirmation conditions.
For a confirmed CALL, two consecutive qualifying candles must close above the 9 EMA.
For a confirmed PUT, two consecutive qualifying candles must close below the 9 EMA.
This helps prevent confirming a breakout while price is still trading against short-term momentum.
🔵 **BLUE SOLID — 20 EMA**
The 20 EMA helps identify the short-term trend.
When the 9 EMA is above the 20 EMA, shorter-term momentum may be bullish.
When the 9 EMA is below the 20 EMA, shorter-term momentum may be bearish.
Your indicator displays special triangles when the 9 EMA crosses the 20 EMA.
The 20 EMA is not a mandatory confirmed-trade condition.
🔴 **RED SOLID — 200 EMA**
The 200 EMA provides a longer-term trend reference.
Price above the 200 EMA can suggest a stronger bullish background.
Price below the 200 EMA can suggest a stronger bearish background.
The 200 EMA can also act as an area of potential support or resistance.
It does not determine confirmed CALL or PUT signals.
⚪ **WHITE SOLID — VWAP**
VWAP stands for Volume Weighted Average Price.
It represents an average price weighted by trading volume during the session.
VWAP is one of your four mandatory confirmation rules.
- Confirmed CALL: Price must close above VWAP.
- Confirmed PUT: Price must close below VWAP.
VWAP helps you recognize whether price is trading above or below the session's volume-weighted average.
---
## SECTION 3 — CONFIRMED CALL SIGNALS
### What creates a confirmed CALL?
A confirmed CALL requires **all four conditions**:
**RULE 1 — ORB BREAKOUT**
Two consecutive qualifying candles close above the selected ORB high.
**RULE 2 — 9 EMA CONFIRMATION**
Two consecutive qualifying candles close above the 9 EMA.
**RULE 3 — VWAP CONFIRMATION**
Price closes above VWAP.
**RULE 4 — RSI CONFIRMATION**
RSI(14) on the current chart timeframe is at least 60.
### Example of a confirmed CALL
Suppose:
- The 5-minute ORB high is $250.00.
- Two qualifying candles close at $250.15 and $250.30.
- Both candles close above the 9 EMA.
- Price is above VWAP.
- RSI reads 64.
All four conditions agree.
The indicator can display:
🟢 **CALL — CONFIRMED**
### What does the CALL label mean?
It means the indicator has identified a bullish setup according to your rules.
It does not mean the price will continue rising or that a CALL option is guaranteed to gain value.
Before acting, consider nearby resistance, the stop distance, potential reward, and option-specific risks.
---
## SECTION 4 — CONFIRMED PUT SIGNALS
A confirmed PUT requires **all four opposite conditions**.
**RULE 1 — ORB BREAKDOWN**
Two consecutive qualifying candles close below the selected ORB low.
**RULE 2 — 9 EMA CONFIRMATION**
Two consecutive qualifying candles close below the 9 EMA.
**RULE 3 — VWAP CONFIRMATION**
Price closes below VWAP.
**RULE 4 — RSI CONFIRMATION**
RSI(14) on the current chart timeframe is 40 or lower.
### Example of a confirmed PUT
Suppose:
- The 5-minute ORB low is $248.00.
- Two qualifying candles close at $247.85 and $247.60.
- Both candles close below the 9 EMA.
- Price is below VWAP.
- RSI reads 36.
All four conditions agree.
The indicator can display:
🔴 **PUT — CONFIRMED**
### Important confirmation rule
**MACD is NOT required for confirmed CALL or PUT signals.**
Your confirmed-trade rules are ORB, 9 EMA, VWAP, and RSI only.
---
## SECTION 5 — EARLY CALL AND PUT SIGNALS
Early signals identify momentum that may develop into a breakout.
They are not confirmed trades.
### EARLY CALL REQUIREMENTS
- MACD is above its signal line.
- RSI is 60 or higher.
- Price closes above the 9 EMA.
- VWAP agreement is not required.
- An ORB breakout is not required.
🟢 **EARLY CALL** indicates bullish momentum may be developing.
### EARLY PUT REQUIREMENTS
- MACD is below its signal line.
- RSI is 40 or lower.
- Price closes below the 9 EMA.
- VWAP agreement is not required.
- An ORB breakout is not required.
🔴 **EARLY PUT** indicates bearish momentum may be developing.
### How to use early signals
An early signal is a reason to watch the chart more closely.
For example, an EARLY CALL appears while price is still inside the opening range.
You can then watch whether price breaks the ORB high and completes the remaining confirmation conditions.
Early signals are designed to appear after the selected opening range has formed, while price is still within that range.
**Do not confuse EARLY with CONFIRMED.**
---
## SECTION 6 — CHART SYMBOL LEGEND
🟢 **GREEN DOT — PRICE CROSSES ABOVE 9 EMA**
A candle crosses and closes above the 9 EMA.
This suggests improving short-term bullish momentum.
It is not a confirmed CALL.
🔴 **RED DOT — PRICE CROSSES BELOW 9 EMA**
A candle crosses and closes below the 9 EMA.
This suggests weakening short-term momentum or increasing bearish pressure.
It is not a confirmed PUT.
🟢 **GREEN UPWARD TRIANGLE — 9 EMA CROSSES ABOVE 20 EMA**
This is a bullish moving-average crossover.
It may indicate improving trend direction.
It is not a confirmed CALL.
🔴 **RED DOWNWARD TRIANGLE — 9 EMA CROSSES BELOW 20 EMA**
This is a bearish moving-average crossover.
It may indicate weakening trend direction.
It is not a confirmed PUT.
🟢 **EARLY CALL MARKER**
Bullish momentum conditions are satisfied, but the full confirmation requirements are not.
🔴 **EARLY PUT MARKER**
Bearish momentum conditions are satisfied, but the full confirmation requirements are not.
🟢 **CALL LABEL**
All four confirmed bullish conditions agree.
🔴 **PUT LABEL**
All four confirmed bearish conditions agree.
❌ **ATR STOP**
The ATR trailing-stop condition has been triggered.
❌ **7 EMA EXIT**
The 7 EMA exit condition has been triggered.
Stop-loss and exit labels can be hidden in the indicator settings without hiding the plotted stop lines.
---
## SECTION 7 — SUPPORT AND RESISTANCE LINE LEGEND
These lines mark important historical price levels.
🟡 **YELLOW DASHED — PREMARKET HIGH**
The highest price reached during the premarket session.
🟡 **YELLOW DASHED — PREMARKET LOW**
The lowest price reached during the premarket session.
🟢 **GREEN DASHED — PREVIOUS DAY HIGH**
The highest price of the previous trading day.
🔴 **RED DASHED — PREVIOUS DAY LOW**
The lowest price of the previous trading day.
🟢 **GREEN DOTTED — PREVIOUS WEEK HIGH**
The highest price of the previous trading week.
🔴 **RED DOTTED — PREVIOUS WEEK LOW**
The lowest price of the previous trading week.
### How to use these levels
These areas may act as support, resistance, breakout points, or reversal areas.
For example, a confirmed CALL appearing directly beneath the previous-day high may face nearby resistance.
A confirmed PUT appearing directly above the previous-day low may encounter support.
These reference levels are not mandatory confirmation conditions.
---
## SECTION 8 — ATR TRAILING STOP
### What is ATR?
ATR stands for Average True Range.
It measures price volatility.
ATR helps estimate how much price has recently been moving, rather than using a fixed number of cents or dollars for every trade.
### Default ATR settings
- ATR trailing stop: Enabled
- ATR length: 14
- ATR multiplier: 1.0
- ATR timeframe: Current chart
- Color: Red
- Style: Dashed
- Width: Adjustable
### How the ATR trailing stop works
For a CALL, the trailing stop moves upward when price makes favorable progress.
It does not move downward when price pulls back.
For a PUT, the trailing stop moves downward when price makes favorable progress.
It does not move upward when price rebounds.
This is called a ratcheting stop.
### Adjusting the ATR multiplier
**0.5× ATR — Very tight**
- Stop remains relatively close to price.
- Can trigger quickly.
- May exit during ordinary market fluctuations.
**0.8× ATR — Tight**
- Allows slightly more movement.
- May appeal to traders who prefer fast exits.
**1.0× ATR — Your default**
- A starting point for comparing a volatility-based exit with your usual moving-average exits.
**1.5× ATR — Looser**
- Allows larger price fluctuations.
- May help avoid some premature exits.
- Can give back more profit.
**2.0× ATR — Wide**
- Gives the trade substantially more room.
- May be more suitable for stronger trends.
- Can result in a larger loss or greater profit giveback.
### Is ATR timeframe-sensitive?
Yes.
ATR(14) on a 1-minute chart measures volatility across fourteen 1-minute candles.
ATR(14) on a 5-minute chart measures volatility across fourteen 5-minute candles.
These are different measurements.
Your indicator allows the ATR timeframe to be adjusted.
The ATR stop is a visual calculation and alert mechanism. It does not automatically place a brokerage stop-loss order.
---
## SECTION 9 — 7 EMA EXIT STRATEGY
The 7 EMA is a separate exit method.
It was selected because it reacts more slowly than the 5 EMA but more quickly than the 9 EMA.
### Default appearance
🔴 **RED DASHED — 7 EMA EXIT LINE**
- Length: 7
- Color: Red
- Style: Dashed
- Width: Adjustable
- Visibility: Adjustable
### CALL exit rule
After a confirmed CALL, a completed candle closing below the 7 EMA triggers an EXIT CALL condition.
### PUT exit rule
After a confirmed PUT, a completed candle closing above the 7 EMA triggers an EXIT PUT condition.
### 5 EMA vs. 7 EMA vs. 9 EMA
**5 EMA:** Fastest response. May signal exits quickly.
**7 EMA:** Middle-ground response. May tolerate slightly more pullback.
**9 EMA:** Slowest of the three. Often provides more room before an EMA-based exit.
### How the 7 EMA differs from ATR
The 7 EMA follows average price and can move in either direction.
The ATR trailing stop follows a volatility-based calculation and is designed not to retreat against the trade.
You can display both simultaneously.
You should decide before entering a real trade which method controls your exit.
---
## SECTION 10 — STOP LOSS SETTINGS
The Stop Loss Settings section groups both exit strategies.
### ATR settings
- Show/hide ATR trailing stop
- ATR length
- ATR multiplier
- ATR timeframe
- Line color
- Line style
- Line width
### 7 EMA settings
- Show/hide 7 EMA exit line
- EMA length
- Line color
- Line style
- Line width
### Labels and alerts
The indicator includes optional ATR STOP and 7 EMA EXIT labels and corresponding alert conditions.
You can turn off the STOP/EXIT labels to keep your chart cleaner.
The stop lines can remain visible.
Alerts must be configured separately in TradingView.
---
## SECTION 11 — YOUR SIX-ROW DASHBOARD
The dashboard summarizes the current chart conditions.
**ROW 1 — ORB**
Indicates whether the selected ORB breakout condition supports CALL or PUT.
**ROW 2 — 9 EMA / TWO CANDLES**
Shows whether the two-candle EMA confirmation condition agrees with the trade direction.
**ROW 3 — VWAP**
Shows whether price is above or below VWAP.
**ROW 4 — RSI**
Displays the current chart timeframe RSI condition.
RSI at or above 60 supports CALL.
RSI at or below 40 supports PUT.
**ROW 5 — UNCONFIRMED CALL/PUT**
Displays early momentum conditions.
These use MACD, RSI, and EMA 9.
**ROW 6 — CONFIRMED CALL/PUT**
Displays the fully confirmed trading condition.
All four mandatory requirements must agree.
### Dashboard appearance
You can adjust:
- Visibility
- Screen position
- Text size
- Background colors
- Text colors
The dashboard is intended to make your rules easier to review without searching through every chart line.
---
## SECTION 12 — HOW TO USE THE INDICATOR EACH MORNING
**STEP 1 — BEFORE MARKET OPEN**
Identify premarket high and low, previous-day high and low, and previous-week high and low.
Observe the broader trend and nearby price levels.
**STEP 2 — AT 9:30 AM**
Allow the opening range to begin forming.
Avoid treating an unfinished ORB as a completed breakout.
**STEP 3 — AT 9:35 AM**
Your default 5-minute ORB is complete.
Identify its high and low.
**STEP 4 — WATCH FOR EARLY SIGNALS**
An EARLY CALL or EARLY PUT may appear while price remains inside the opening range.
Use this as a momentum warning.
**STEP 5 — WAIT FOR CONFIRMATION**
For CALL:
- Two qualifying closes above ORB high
- Two qualifying closes above EMA 9
- Close above VWAP
- RSI ≥ 60
For PUT:
- Two qualifying closes below ORB low
- Two qualifying closes below EMA 9
- Close below VWAP
- RSI ≤ 40
**STEP 6 — CHECK YOUR RISK**
Before entering, determine your planned stop, potential loss, position size, and nearby support or resistance.
**STEP 7 — MANAGE YOUR EXIT**
Watch your ATR trailing stop and 7 EMA exit conditions.
Follow your predetermined exit plan rather than changing methods during the trade without a reason.
**STEP 8 — REVIEW THE TRADE**
Record your entry, RSI reading, ORB level, stop distance, exit signal, and result.
Review multiple trades to determine whether your selected settings suit your market and timeframe.
---
## SECTION 13 — IMPORTANT REMINDERS
- Confirmed CALL/PUT requires ORB, EMA 9, VWAP, and RSI.
- MACD does not confirm trades.
- Early signals are not confirmed entries.
- EMA crossover dots and triangles are informational.
- ATR and 7 EMA are exit-management tools.
- Changing chart timeframes changes EMA, RSI, MACD, and ATR calculations.
- Indicator signals do not guarantee profitable trades.
- TradingView alerts do not automatically place orders.
- Option prices are also affected by implied volatility, time decay, and bid-ask spreads.
**YOUR MAIN TRADING RULE:**
Wait for the four mandatory confirmation conditions to agree, evaluate the risk, and manage the trade according to your chosen exit strategy.
This guide describes the intended v7.5 configuration. Signal timing and alert behavior should be checked against the installed Pine Script in TradingView before relying on it for live trades.

כתב ויתור
המידע והפרסומים אינם מיועדים להיות, ואינם מהווים, ייעוץ או המלצה פיננסית, השקעתית, מסחרית או מכל סוג אחר המסופקת או מאושרת על ידי TradingView. קרא עוד ב־תנאי השימוש.
כתב ויתור
המידע והפרסומים אינם מיועדים להיות, ואינם מהווים, ייעוץ או המלצה פיננסית, השקעתית, מסחרית או מכל סוג אחר המסופקת או מאושרת על ידי TradingView. קרא עוד ב־תנאי השימוש.