WiselyWealth ; Auto Range & Deviation Detector
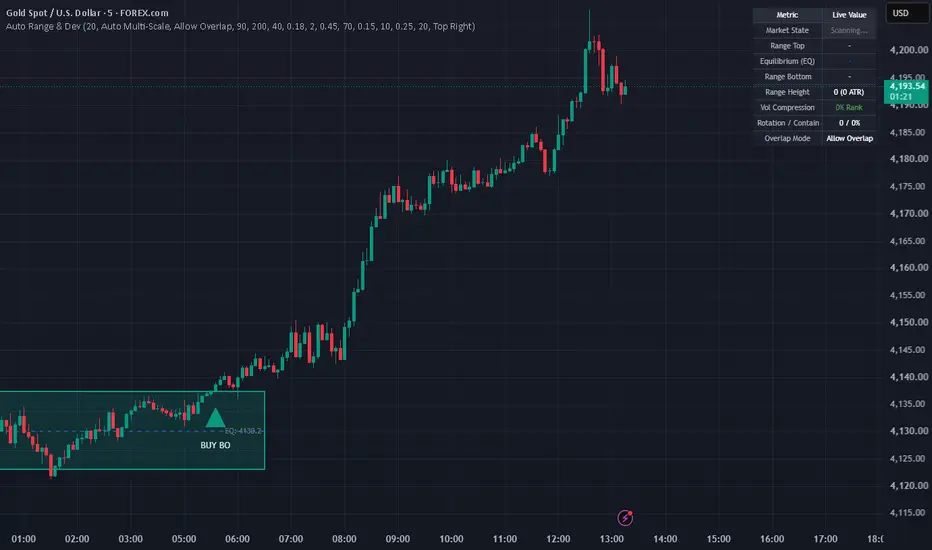
**Indicator Feature Description: Auto Range & Deviation Detector**
**1. Introduction: What is this script and its purpose?**
The script provided is named "Auto Range & Deviation Detector." It is an advanced technical indicator developed using Pine Script (version 6) for the TradingView platform. The primary purpose of this script is to systematically and automatically detect market consolidations or "ranging" phases, eliminating the subjective bias often introduced when traders draw support and resistance lines manually.
Once the system successfully outlines a statistically significant price range (Range Box), its secondary objective is to monitor price action around these boundaries to generate two distinct types of trading signals: Trend Breakout signals (for trend-following) and Deviation/Liquidity Sweep signals (Fakeouts) for mean-reversion trading strategies.
**2. Operating Mechanism: How does it detect trading signals?**
The mechanism behind this indicator is highly sophisticated and relies heavily on statistical principles. It is divided into two core engines: the Range Detection Engine and the Signal Generation Engine.
**A. Range Detection Engine**
The system does not arbitrarily draw a box every time the market pauses. Instead, it evaluates price action through five strict Quality and Validation Filters:
* **Volatility Compression:** The system calculates the height of the potential range relative to the Average True Range (ATR) and ranks it using a percent-rank function (compressionRank). This ensures the range is genuinely experiencing volatility compression below a specified threshold (e.g., the 40th percentile).
* **Rotation Rate:** To prevent drawing horizontal boxes during slow, directional drifts, the price must frequently cross back and forth across the Equilibrium (50% Midline). This rotation rate must meet a minimum threshold (e.g., 0.18), confirming active two-way auctioning between buyers and sellers.
* **Min Touches:** Both the upper and lower boundaries must be tested by price action at least a minimum number of times (default is 2). The system allows a small tolerance (0.1 * ATR) for these touches, confirming that the boundaries represent structural horizontal support and resistance.
* **Max Drift:** The system measures the slope of the price action using Linear Regression normalized by the ATR. If the slope exceeds the maximum permissible drift, the candidate range is rejected. This prevents upward or downward trending channels from being misidentified as horizontal consolidations.
* **Min Containment:** A minimum percentage of candle closing prices (default 70%) must remain strictly confined within the top and bottom boundaries across the scan window.
**B. Signal Generation Engine**
Once a valid range is established, the system detects four main trading signals, utilizing the ATR as a dynamic buffer to filter out market noise:
1. **BUY Breakout (BUY BO):** Triggered when a candle closes above the range's upper boundary plus an ATR-based buffer zone (Breakout Buffer x ATR). This signals that buyers have decisively broken resistance, indicating a potential bullish trend.
2. **SELL Breakdown (SELL BD):** Triggered when a candle closes below the lower boundary minus the ATR buffer zone, indicating decisive selling pressure and a potential bearish trend.
3. **BUY Deviation / Liquidity Sweep (BUY DEV):** A mean-reversion buy signal. It can occur in a single bar (price wicks below the lower boundary but closes inside) or across multiple bars (price breaks down, but within a "Deviation Window," reverses and closes back inside the range). This pattern represents a "stop hunt" or liquidity sweep before an upward move.
4. **SELL Deviation / Liquidity Sweep (SELL DEV):** A mean-reversion sell signal. This happens when the price spikes above the upper boundary, sweeping buy-stop liquidity, only to reverse and close back inside the range.
Additionally, the script features an **Absorb Overshoot** mechanic. If a wick slightly penetrates the boundary (less than 0.25 ATR) but the candle closes inside, the system automatically expands the boundary to absorb the minor overshoot, keeping the range intact and flexible.
**3. Application: How to configure and which markets are suitable?**
* **Configuration Settings:**
* **Scan Scale Mode:** It is highly recommended to use the "Auto Multi-Scale" mode. This allows the engine to simultaneously evaluate three lookback periods (Base 1x, Medium 2x, Wide 3x) and select the most robust consolidation phase.
* **Box Overlap Mode:** If you want to analyze micro-structures and overlapping phases, use "Allow Overlap." However, for identifying distinct market cycles, "No Price Overlap" or "Strict No Overlap" is preferable to keep the chart clean.
* **Buffer & ATR Adjustments:** In highly volatile markets prone to deep wicks, increasing the "Breakout Buffer (x ATR)" will demand stronger confirmation for breakouts, reducing false signals.
* **Suitable Markets:**
* This indicator excels in highly liquid markets where "stop hunts" and liquidity sweeps at key levels are common occurrences. It is highly suitable for Cryptocurrency markets (Bitcoin, Ethereum), major Forex pairs (EUR/USD, GBP/USD), and major Indices (S&P 500, Nasdaq). The Deviation (Sweep) logic is specifically designed to capitalize on the trap patterns prevalent in these markets.
* **Timeframes:**
* The script performs optimally on medium to higher timeframes (15-minute, 1-hour, 4-hour, and Daily charts). Applying it to timeframes lower than 5 minutes may generate excessive noise and rapid overlapping ranges, though the ATR-based logic will still attempt to normalize the volatility.
**1. Introduction: What is this script and its purpose?**
The script provided is named "Auto Range & Deviation Detector." It is an advanced technical indicator developed using Pine Script (version 6) for the TradingView platform. The primary purpose of this script is to systematically and automatically detect market consolidations or "ranging" phases, eliminating the subjective bias often introduced when traders draw support and resistance lines manually.
Once the system successfully outlines a statistically significant price range (Range Box), its secondary objective is to monitor price action around these boundaries to generate two distinct types of trading signals: Trend Breakout signals (for trend-following) and Deviation/Liquidity Sweep signals (Fakeouts) for mean-reversion trading strategies.
**2. Operating Mechanism: How does it detect trading signals?**
The mechanism behind this indicator is highly sophisticated and relies heavily on statistical principles. It is divided into two core engines: the Range Detection Engine and the Signal Generation Engine.
**A. Range Detection Engine**
The system does not arbitrarily draw a box every time the market pauses. Instead, it evaluates price action through five strict Quality and Validation Filters:
* **Volatility Compression:** The system calculates the height of the potential range relative to the Average True Range (ATR) and ranks it using a percent-rank function (compressionRank). This ensures the range is genuinely experiencing volatility compression below a specified threshold (e.g., the 40th percentile).
* **Rotation Rate:** To prevent drawing horizontal boxes during slow, directional drifts, the price must frequently cross back and forth across the Equilibrium (50% Midline). This rotation rate must meet a minimum threshold (e.g., 0.18), confirming active two-way auctioning between buyers and sellers.
* **Min Touches:** Both the upper and lower boundaries must be tested by price action at least a minimum number of times (default is 2). The system allows a small tolerance (0.1 * ATR) for these touches, confirming that the boundaries represent structural horizontal support and resistance.
* **Max Drift:** The system measures the slope of the price action using Linear Regression normalized by the ATR. If the slope exceeds the maximum permissible drift, the candidate range is rejected. This prevents upward or downward trending channels from being misidentified as horizontal consolidations.
* **Min Containment:** A minimum percentage of candle closing prices (default 70%) must remain strictly confined within the top and bottom boundaries across the scan window.
**B. Signal Generation Engine**
Once a valid range is established, the system detects four main trading signals, utilizing the ATR as a dynamic buffer to filter out market noise:
1. **BUY Breakout (BUY BO):** Triggered when a candle closes above the range's upper boundary plus an ATR-based buffer zone (Breakout Buffer x ATR). This signals that buyers have decisively broken resistance, indicating a potential bullish trend.
2. **SELL Breakdown (SELL BD):** Triggered when a candle closes below the lower boundary minus the ATR buffer zone, indicating decisive selling pressure and a potential bearish trend.
3. **BUY Deviation / Liquidity Sweep (BUY DEV):** A mean-reversion buy signal. It can occur in a single bar (price wicks below the lower boundary but closes inside) or across multiple bars (price breaks down, but within a "Deviation Window," reverses and closes back inside the range). This pattern represents a "stop hunt" or liquidity sweep before an upward move.
4. **SELL Deviation / Liquidity Sweep (SELL DEV):** A mean-reversion sell signal. This happens when the price spikes above the upper boundary, sweeping buy-stop liquidity, only to reverse and close back inside the range.
Additionally, the script features an **Absorb Overshoot** mechanic. If a wick slightly penetrates the boundary (less than 0.25 ATR) but the candle closes inside, the system automatically expands the boundary to absorb the minor overshoot, keeping the range intact and flexible.
**3. Application: How to configure and which markets are suitable?**
* **Configuration Settings:**
* **Scan Scale Mode:** It is highly recommended to use the "Auto Multi-Scale" mode. This allows the engine to simultaneously evaluate three lookback periods (Base 1x, Medium 2x, Wide 3x) and select the most robust consolidation phase.
* **Box Overlap Mode:** If you want to analyze micro-structures and overlapping phases, use "Allow Overlap." However, for identifying distinct market cycles, "No Price Overlap" or "Strict No Overlap" is preferable to keep the chart clean.
* **Buffer & ATR Adjustments:** In highly volatile markets prone to deep wicks, increasing the "Breakout Buffer (x ATR)" will demand stronger confirmation for breakouts, reducing false signals.
* **Suitable Markets:**
* This indicator excels in highly liquid markets where "stop hunts" and liquidity sweeps at key levels are common occurrences. It is highly suitable for Cryptocurrency markets (Bitcoin, Ethereum), major Forex pairs (EUR/USD, GBP/USD), and major Indices (S&P 500, Nasdaq). The Deviation (Sweep) logic is specifically designed to capitalize on the trap patterns prevalent in these markets.
* **Timeframes:**
* The script performs optimally on medium to higher timeframes (15-minute, 1-hour, 4-hour, and Daily charts). Applying it to timeframes lower than 5 minutes may generate excessive noise and rapid overlapping ranges, though the ATR-based logic will still attempt to normalize the volatility.

כתב ויתור
המידע והפרסומים אינם מיועדים להיות, ואינם מהווים, ייעוץ או המלצה פיננסית, השקעתית, מסחרית או מכל סוג אחר המסופקת או מאושרת על ידי TradingView. קרא עוד ב־תנאי השימוש.
כתב ויתור
המידע והפרסומים אינם מיועדים להיות, ואינם מהווים, ייעוץ או המלצה פיננסית, השקעתית, מסחרית או מכל סוג אחר המסופקת או מאושרת על ידי TradingView. קרא עוד ב־תנאי השימוש.