OPEN-SOURCE SCRIPT
CVD Absorption - Outcome Statistics [Dots3Red]
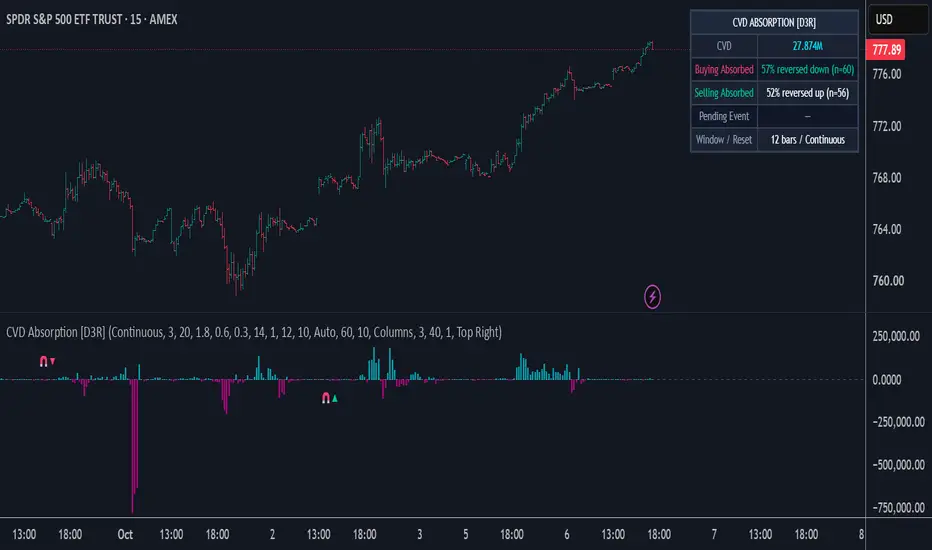
🧲 CVD ABSORPTION - OUTCOME STATISTICS [Dots3Red]
This indicator plots an approximated Cumulative Volume Delta, flags absorption events (heavy volume on a small-range bar with clearly one-sided pressure), and measures how often each type of absorption was followed by a reversal on the current chart, shown as a percentage with the sample size next to it.
✨ WHY THIS MATTERS
Absorption is a classic order-flow idea: a lot of buying (or selling) hits the market, but price barely moves. Someone on the other side quietly took all of it. When the aggressive side runs out, price often turns. Plenty of tools flag absorption, but very few say whether it actually led to a reversal on the instrument you trade. On some charts it is a reliable warning; on others it means nothing. This script keeps score so you can see which applies to yours.
⚙️ HOW IT WORKS
📊 Delta approximation — each bar's volume is split into buying and selling pressure based on where the close sits within the bar's range: a close near the high counts as mostly buying, a close near the low as mostly selling. The running total is the CVD line. This is a standard approximation for feeds without bid/ask data, not true order flow.
🧲 Absorption detection — a bar is flagged when all three conditions hold on that bar alone:
• Volume is well above its recent average
• The bar's range is small relative to ATR
• Delta is clearly one-sided (a set fraction of the bar's own volume)
Two types are tracked separately:
• Buying absorbed — heavy buying, price barely advanced (bearish lean)
• Selling absorbed — heavy selling, price barely fell (bullish lean)
🎯 Outcome grading — each event is graded on whether price then moved a set ATR distance against the absorbed pressure within the outcome window. The ATR is frozen at the moment of the event. Events that don't reach the distance in time count as not reversed.
🔒 Non-repainting — events are detected and graded on confirmed bars only. Once a marker appears it does not move or disappear.
🖥️ Dashboard — current CVD, reversal rate and sample size for each absorption type, the event currently being graded, and the outcome window and reset mode.
🧭 HOW TO USE
1️⃣ Read the rate before reacting to a marker. "Buying absorbed: 62% reversed down (n=34)" means that on this chart, heavy buying that got stuck was followed by a meaningful drop most of the time. A rate near or below 50% means absorption hasn't been a useful reversal tell here.
2️⃣ Let the sample build. Absorption events are not frequent. The dashboard shows "Collecting…" until each type has enough graded events.
3️⃣ Context matters. Absorption at a range high or low, VWAP, or the previous day's high or low is usually more meaningful than absorption in the middle of a range.
4️⃣ Tune detection to the instrument. Lower the volume threshold or allow a larger range for more events; tighten them for fewer, more extreme ones.
5️⃣ Use it as context, not a trigger. The rates describe how absorption has behaved on this chart. They do not predict the next event.
⏱️ WHICH TIMEFRAMES WORK BEST
5-minute through 1-hour on liquid instruments such as index futures, large-cap stocks and major crypto. Absorption is an intraday concept, and these charts produce enough events to build a sample. 4-hour works but fills slowly. On daily and higher, each bar holds too much activity to read as a single absorption event.
🛠️ SETTINGS
📊 CVD Calculation — reset mode (continuous, day, week), delta smoothing for display
🧲 Absorption Detection — volume average length, volume threshold (× average), max range (× ATR), min directional delta (× volume)
🎯 Outcome Grading — ATR length, reversal confirmation (× ATR), outcome window, minimum events to show a rate
📶 Delta Histogram — show/hide, scaling (Auto fits the histogram to a share of the CVD line's range, Manual multiplier, or Raw values), style (columns, histogram, area), width, positive/negative colors, transparency. Scaling changes only the drawing; the dashboard always shows real values.
🎨 Visualization — CVD line and thickness, absorption markers and their colors
🖥️ Dashboard — show/hide, position
🔔 Alerts — buying absorbed, selling absorbed
📝 NOTES
Delta here is estimated from bar shape, not from bid/ask data, so it reflects buying and selling pressure only approximately. On spot forex, TradingView volume is typically tick volume from a single source, which makes volume-based readings less reliable. All rates are specific to this chart, timeframe and settings, and do not transfer to other instruments or configurations.
⚠️ DISCLAIMER
This is an analytical and visualization tool. It does not generate trade signals and does not constitute financial advice. Historical statistics do not guarantee future performance.
This indicator plots an approximated Cumulative Volume Delta, flags absorption events (heavy volume on a small-range bar with clearly one-sided pressure), and measures how often each type of absorption was followed by a reversal on the current chart, shown as a percentage with the sample size next to it.
✨ WHY THIS MATTERS
Absorption is a classic order-flow idea: a lot of buying (or selling) hits the market, but price barely moves. Someone on the other side quietly took all of it. When the aggressive side runs out, price often turns. Plenty of tools flag absorption, but very few say whether it actually led to a reversal on the instrument you trade. On some charts it is a reliable warning; on others it means nothing. This script keeps score so you can see which applies to yours.
⚙️ HOW IT WORKS
📊 Delta approximation — each bar's volume is split into buying and selling pressure based on where the close sits within the bar's range: a close near the high counts as mostly buying, a close near the low as mostly selling. The running total is the CVD line. This is a standard approximation for feeds without bid/ask data, not true order flow.
🧲 Absorption detection — a bar is flagged when all three conditions hold on that bar alone:
• Volume is well above its recent average
• The bar's range is small relative to ATR
• Delta is clearly one-sided (a set fraction of the bar's own volume)
Two types are tracked separately:
• Buying absorbed — heavy buying, price barely advanced (bearish lean)
• Selling absorbed — heavy selling, price barely fell (bullish lean)
🎯 Outcome grading — each event is graded on whether price then moved a set ATR distance against the absorbed pressure within the outcome window. The ATR is frozen at the moment of the event. Events that don't reach the distance in time count as not reversed.
🔒 Non-repainting — events are detected and graded on confirmed bars only. Once a marker appears it does not move or disappear.
🖥️ Dashboard — current CVD, reversal rate and sample size for each absorption type, the event currently being graded, and the outcome window and reset mode.
🧭 HOW TO USE
1️⃣ Read the rate before reacting to a marker. "Buying absorbed: 62% reversed down (n=34)" means that on this chart, heavy buying that got stuck was followed by a meaningful drop most of the time. A rate near or below 50% means absorption hasn't been a useful reversal tell here.
2️⃣ Let the sample build. Absorption events are not frequent. The dashboard shows "Collecting…" until each type has enough graded events.
3️⃣ Context matters. Absorption at a range high or low, VWAP, or the previous day's high or low is usually more meaningful than absorption in the middle of a range.
4️⃣ Tune detection to the instrument. Lower the volume threshold or allow a larger range for more events; tighten them for fewer, more extreme ones.
5️⃣ Use it as context, not a trigger. The rates describe how absorption has behaved on this chart. They do not predict the next event.
⏱️ WHICH TIMEFRAMES WORK BEST
5-minute through 1-hour on liquid instruments such as index futures, large-cap stocks and major crypto. Absorption is an intraday concept, and these charts produce enough events to build a sample. 4-hour works but fills slowly. On daily and higher, each bar holds too much activity to read as a single absorption event.
🛠️ SETTINGS
📊 CVD Calculation — reset mode (continuous, day, week), delta smoothing for display
🧲 Absorption Detection — volume average length, volume threshold (× average), max range (× ATR), min directional delta (× volume)
🎯 Outcome Grading — ATR length, reversal confirmation (× ATR), outcome window, minimum events to show a rate
📶 Delta Histogram — show/hide, scaling (Auto fits the histogram to a share of the CVD line's range, Manual multiplier, or Raw values), style (columns, histogram, area), width, positive/negative colors, transparency. Scaling changes only the drawing; the dashboard always shows real values.
🎨 Visualization — CVD line and thickness, absorption markers and their colors
🖥️ Dashboard — show/hide, position
🔔 Alerts — buying absorbed, selling absorbed
📝 NOTES
Delta here is estimated from bar shape, not from bid/ask data, so it reflects buying and selling pressure only approximately. On spot forex, TradingView volume is typically tick volume from a single source, which makes volume-based readings less reliable. All rates are specific to this chart, timeframe and settings, and do not transfer to other instruments or configurations.
⚠️ DISCLAIMER
This is an analytical and visualization tool. It does not generate trade signals and does not constitute financial advice. Historical statistics do not guarantee future performance.
סקריפט קוד פתוח
ברוח האמיתית של TradingView, יוצר הסקריפט הזה הפך אותו לקוד פתוח, כך שסוחרים יוכלו לעיין בו ולאמת את פעולתו. כל הכבוד למחבר! אמנם ניתן להשתמש בו בחינם, אך זכור כי פרסום חוזר של הקוד כפוף ל־כללי הבית שלנו.

Connect the dots to elevate your trading.
כתב ויתור
המידע והפרסומים אינם מיועדים להיות, ואינם מהווים, ייעוץ או המלצה פיננסית, השקעתית, מסחרית או מכל סוג אחר המסופקת או מאושרת על ידי TradingView. קרא עוד ב־תנאי השימוש.
סקריפט קוד פתוח
ברוח האמיתית של TradingView, יוצר הסקריפט הזה הפך אותו לקוד פתוח, כך שסוחרים יוכלו לעיין בו ולאמת את פעולתו. כל הכבוד למחבר! אמנם ניתן להשתמש בו בחינם, אך זכור כי פרסום חוזר של הקוד כפוף ל־כללי הבית שלנו.
Connect the dots to elevate your trading.
כתב ויתור
המידע והפרסומים אינם מיועדים להיות, ואינם מהווים, ייעוץ או המלצה פיננסית, השקעתית, מסחרית או מכל סוג אחר המסופקת או מאושרת על ידי TradingView. קרא עוד ב־תנאי השימוש.