OPEN-SOURCE SCRIPT
מעודכן Risk Management Calculator [tradeviZion]
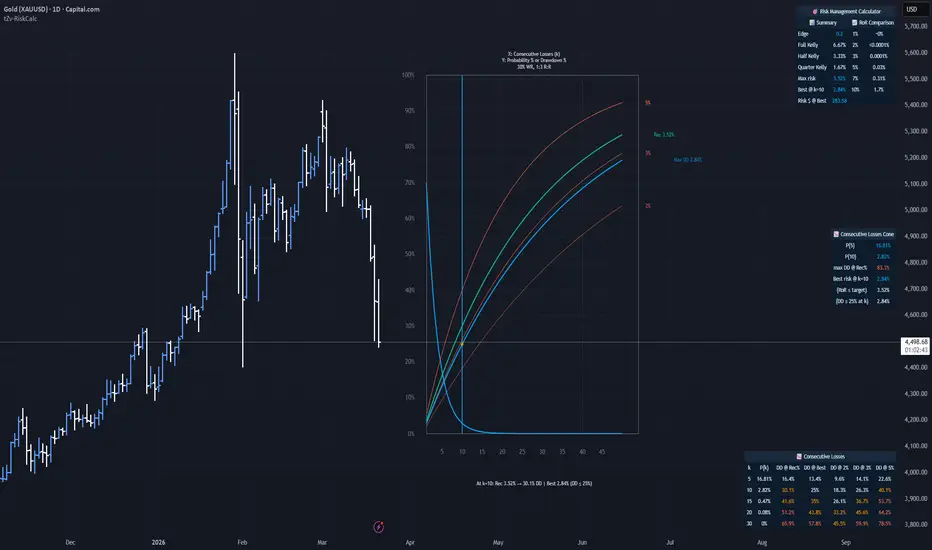
Risk Management Calculator [tradeviZion] - Script Description

📖 Overview
The Risk Management Calculator [tradeviZion] helps you find the optimal risk per trade based on your strategy's win rate, risk-to-reward ratio, and your tolerance for drawdowns and blowout risk. Instead of guessing a fixed 1–2%, it uses established formulas (Edge, Kelly criterion, and Risk of Ruin) to suggest a risk % that balances growth with survival.
Designed for swing traders, day traders, and systematic traders who want to size positions mathematically rather than by rule of thumb.
---
⚙️ How It Works
⚪ Edge
Your edge is the expected value per unit risked. Positive edge means the strategy is profitable in expectation.
Pine Script®
Example: 30% win rate, 1:3 R:R → Edge = 0.30×3 − 0.70 = 0.20 (positive expectancy).
⚪ Risk of Ruin
The probability of losing your entire account. The formula uses your edge and risk fraction:
Pine Script®
where r is risk per trade. Assumes a long series of independent bets with stable edge. Lower risk per trade reduces RoR. Doubling risk increases RoR more than linearly. Approximation; may break down with skewed returns or finite horizons.
⚪ Kelly Criterion
The Kelly fraction maximizes long-run geometric growth. Full Kelly is often too aggressive; Half or Quarter Kelly is commonly used.
Pine Script®
⚪ Consecutive Losses
Probability of k losses in a row:
Pine Script®
Drawdown after k losses:
Pine Script®
⚪ Best Risk
In Solve mode, the script finds the maximum risk % such that RoR ≤ your target. The Consecutive Losses Cone also computes a best risk % that keeps drawdown at your selected k within your Cone Max DD % limit, and uses the stricter of the two.
---
🎯 How to Use

---
⚙️ Settings
Core Parameters
Target RoR Mode
Consecutive Losses
Table Settings
Display

---
⚠️ Disclaimer
This indicator is for educational and informational purposes only. It does not constitute investment advice. Past performance and backtested statistics do not guarantee future results. The RoR formula is an approximation and may not hold under skewed returns or finite horizons. Always do your own research and consider consulting a qualified financial advisor before trading.
📖 Overview
The Risk Management Calculator [tradeviZion] helps you find the optimal risk per trade based on your strategy's win rate, risk-to-reward ratio, and your tolerance for drawdowns and blowout risk. Instead of guessing a fixed 1–2%, it uses established formulas (Edge, Kelly criterion, and Risk of Ruin) to suggest a risk % that balances growth with survival.
Designed for swing traders, day traders, and systematic traders who want to size positions mathematically rather than by rule of thumb.
One risk % does not fit all. Your edge and tolerance for consecutive losses determine the best risk per trade.
- Edge & Kelly - Computes your strategy edge and Full/Half/Quarter Kelly fractions
- Risk of Ruin - Shows blowout probability at 1% to 10% risk, or solves for max risk given your target RoR
- Consecutive Losses - Probability P(k) and drawdown at k losses for your chosen k values
- Consecutive Losses Cone - Visual pane with P(k) and DD curves (2%, 3%, 5%, Rec, Max DD), k marker (vertical line + dot), best risk % for your selected k. Labels on curves; hover for tooltips. Optional legend in table.
---
⚙️ How It Works
⚪ Edge
Your edge is the expected value per unit risked. Positive edge means the strategy is profitable in expectation.
Example: 30% win rate, 1:3 R:R → Edge = 0.30×3 − 0.70 = 0.20 (positive expectancy).
⚪ Risk of Ruin
The probability of losing your entire account. The formula uses your edge and risk fraction:
where r is risk per trade. Assumes a long series of independent bets with stable edge. Lower risk per trade reduces RoR. Doubling risk increases RoR more than linearly. Approximation; may break down with skewed returns or finite horizons.
⚪ Kelly Criterion
The Kelly fraction maximizes long-run geometric growth. Full Kelly is often too aggressive; Half or Quarter Kelly is commonly used.
⚪ Consecutive Losses
Probability of k losses in a row:
Drawdown after k losses:
⚪ Best Risk
In Solve mode, the script finds the maximum risk % such that RoR ≤ your target. The Consecutive Losses Cone also computes a best risk % that keeps drawdown at your selected k within your Cone Max DD % limit, and uses the stricter of the two.
---
🎯 How to Use
- Add the indicator to your chart (any symbol; it uses inputs only)
- Enter your Account Capital, Win Rate %, and Risk-to-Reward Ratio from your backtest or live stats
- Choose Mode: Solve for max risk % to get recommended risk, or Show RoR for given risk % to analyze a specific risk level
- Review the Summary (Edge, Kelly, Recommended risk, Risk amount) and RoR Comparison table
- Check the Consecutive Losses section to see P(k) and drawdown at your k values
- Use the Probability Cone to visualize curves and the best risk % for your Cone Risk Marker k and Cone Max DD %. Hover cone labels for tooltips. Enable Cone Legend for a table legend.
---
⚙️ Settings
Core Parameters
- Account Capital - Your trading capital. Used to show risk amount in dollars (e.g., 2% = $200 on $10,000).
- Win Rate % - Percentage of winning trades (e.g., 30 = 30% winners, 70% losers).
- Risk-to-Reward Ratio - Profit per unit risk (e.g., 3 = 1:3 R:R).
- Target RoR % - Maximum acceptable Risk of Ruin. Lower = safer. Used when Mode is Solve for max risk %.
Target RoR Mode
- Mode - Solve for max risk %: finds max risk within Target RoR. Show RoR for given risk %: shows RoR at Reference Risk %.
- Reference Risk % - Risk % to analyze when Mode is Show RoR.
Consecutive Losses
- k₁ to k₅ - Number of consecutive losses to analyze. Example: k₁=5 shows P(5) and drawdown at 5 losses in a row.
Table Settings
- Color Theme - Dark, Light, Ocean Blue, Forest Green, etc.
- Table Text Size - Tiny, Small, Normal, Large.
- Tables Position - Left, Middle, or Right. All three tables stack vertically: Risk Management Calculator (top), Consecutive Losses Cone (middle), Consecutive Losses (bottom).
Display
- Summary - Edge, Kelly, Recommended risk, Risk amount.
- RoR Comparison - RoR at 1%, 2%, 3%, 5%, 7%, 10%.
- Consecutive Losses - P(k) and DD table for k₁–k₅.
- Probability Cone - P(k) and DD curves in a separate pane.
- Cone Max k - Max consecutive losses on cone x-axis (20–100).
- Cone Risk Marker k - k value highlighted with vertical line and dot.
- Cone Max DD % - Max acceptable drawdown at marker k. Best risk respects this limit.
- Cone Legend - Optional legend in the cone table (P(k) curve, DD curves, Rec%, best risk, k marker). Hover chart labels for the same info.
- P(k) Color, DD Color, DD Rec% Color - Colors for cone curves. DD Rec% also used for best risk curve when RoR-limited (green); theme color when DD-limited.
---
⚠️ Disclaimer
This indicator is for educational and informational purposes only. It does not constitute investment advice. Past performance and backtested statistics do not guarantee future results. The RoR formula is an approximation and may not hold under skewed returns or finite horizons. Always do your own research and consider consulting a qualified financial advisor before trading.
הערות שחרור
🆕 V2 Release NotesUpdate: Mar 20, 2026
- Best @ k — k is how many losses in a row you want to plan for (set it in Cone Risk Marker k). The script shows the risk % that fits your RoR target and your max drawdown at that streak, plus Risk $ @ Best (account size × that %).
- DD @ Best — New column in Consecutive Losses: drawdown at each row using that same Best @ k %.
- Clearer tooltips on settings and tables. Small code cleanup behind the scenes.
סקריפט קוד פתוח
ברוח האמיתית של TradingView, יוצר הסקריפט הזה הפך אותו לקוד פתוח, כך שסוחרים יוכלו לעיין בו ולאמת את פעולתו. כל הכבוד למחבר! אמנם ניתן להשתמש בו בחינם, אך זכור כי פרסום חוזר של הקוד כפוף ל־כללי הבית שלנו.

TradeVizion™
For our premium indicators! whop.com/tradevizion/
For our premium indicators! whop.com/tradevizion/
כתב ויתור
המידע והפרסומים אינם מיועדים להיות, ואינם מהווים, ייעוץ או המלצה פיננסית, השקעתית, מסחרית או מכל סוג אחר המסופקת או מאושרת על ידי TradingView. קרא עוד ב־תנאי השימוש.
סקריפט קוד פתוח
ברוח האמיתית של TradingView, יוצר הסקריפט הזה הפך אותו לקוד פתוח, כך שסוחרים יוכלו לעיין בו ולאמת את פעולתו. כל הכבוד למחבר! אמנם ניתן להשתמש בו בחינם, אך זכור כי פרסום חוזר של הקוד כפוף ל־כללי הבית שלנו.
TradeVizion™
For our premium indicators! whop.com/tradevizion/
For our premium indicators! whop.com/tradevizion/
כתב ויתור
המידע והפרסומים אינם מיועדים להיות, ואינם מהווים, ייעוץ או המלצה פיננסית, השקעתית, מסחרית או מכל סוג אחר המסופקת או מאושרת על ידי TradingView. קרא עוד ב־תנאי השימוש.