CVD Pro: Delta, Divergence & Signals | Delta Ratio
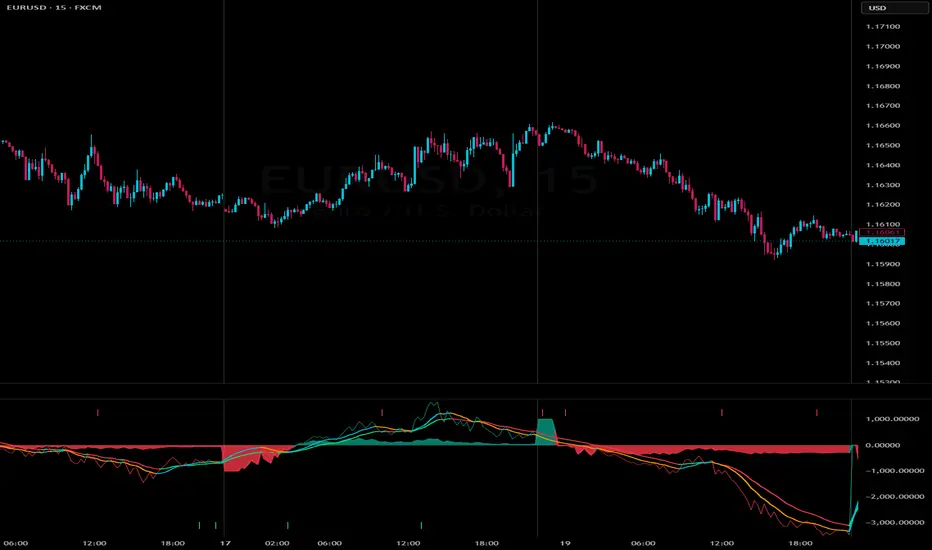
CVD Pro — Delta, Divergence & Signals | Delta Ratio
A professional Cumulative Volume Delta (CVD) indicator that tracks real-time buying vs selling pressure by aggregating 1-minute delta data. Built for traders who want to see order flow divergence before price confirms it.
What It Shows
Plot Description
CVD (thin teal/red) Cumulative delta — running total of (buy volume − sell volume) within each session. Resets daily or weekly.
Delta Ratio (thick teal/red) CVD ÷ total cumulative volume, scaled ×1000. Normalises delta so you can compare relative pressure across instruments and sessions.
EMA of CVD (21-period, lime/red) Smoothed CVD trend. Colour indicates slope — rising or falling.
WMA of CVD (14-period, aqua/orange) Faster-moving average for earlier trend shifts.
Bullish/Bearish Divergence Arrows Detects when CVD makes a higher low while price makes a lower low (bullish), or CVD makes a lower high while price makes a higher high (bearish).
How Divergence Works
The indicator uses ta.pivotlow() and ta.pivothigh() with a configurable lookback (default 3) to identify CVD swing points, then compares the direction of consecutive CVD pivots against price at those same bars:
Bullish signal — CVD trough is rising (higher low) but price at the CVD trough is falling (lower low). Smart money accumulating into weakness.
Bearish signal — CVD peak is falling (lower high) but price at the CVD peak is rising (higher high). Smart money distributing into strength.
Divergences are plotted as arrows at the bottom (bullish) or top (bearish) of the pane, and can be configured as Trading View alerts.
Key Settings
Group Setting Default Purpose
Core Session Reset Daily When the CVD counter resets to zero
EMA Period / Thickness / Colours 21 Trend filter
WMA Length / Thickness / Colours 14 Early-trend detection
Divergence Pivot Lookback 3 Sensitivity — lower = more signals, higher = fewer but stronger
Visual Delta Ratio Scale 1000 Adjusts ratio magnitude for readability
Visual Show/Hide toggles All on Turn off individual plots
Usage Tips
Divergence is most reliable at session extremes. Look for bullish divergence near session lows, bearish divergence near session highs.
Delta Ratio trending above zero while CVD rises = sustained buying absorption. Ratio falling but CVD flat/rising = selling into strength (potential distribution).
EMA & WMA cross. When WMA crosses above EMA while CVD is positive, momentum is accelerating. When they cross below, momentum is fading.
Combine with price structure. Divergence arrows are early signals — wait for a structural trigger (CHoCH, breakout of a prior swing) before entering.
Works on any timeframe. The CVD always builds from 1-minute data regardless of the chart timeframe, so you get the same delta foundation whether you're on a 15M, 1H, or 4H chart.
Alerts
Three built-in alert conditions:
Bull Divergence (CVD) — fires when a new bullish divergence pivot is detected
Bear Divergence (CVD) — fires when a new bearish divergence pivot is detected
New Session Reset — fires when CVD resets at the start of a new daily/weekly session
Version: 1.0
Pine Script: v6
A professional Cumulative Volume Delta (CVD) indicator that tracks real-time buying vs selling pressure by aggregating 1-minute delta data. Built for traders who want to see order flow divergence before price confirms it.
What It Shows
Plot Description
CVD (thin teal/red) Cumulative delta — running total of (buy volume − sell volume) within each session. Resets daily or weekly.
Delta Ratio (thick teal/red) CVD ÷ total cumulative volume, scaled ×1000. Normalises delta so you can compare relative pressure across instruments and sessions.
EMA of CVD (21-period, lime/red) Smoothed CVD trend. Colour indicates slope — rising or falling.
WMA of CVD (14-period, aqua/orange) Faster-moving average for earlier trend shifts.
Bullish/Bearish Divergence Arrows Detects when CVD makes a higher low while price makes a lower low (bullish), or CVD makes a lower high while price makes a higher high (bearish).
How Divergence Works
The indicator uses ta.pivotlow() and ta.pivothigh() with a configurable lookback (default 3) to identify CVD swing points, then compares the direction of consecutive CVD pivots against price at those same bars:
Bullish signal — CVD trough is rising (higher low) but price at the CVD trough is falling (lower low). Smart money accumulating into weakness.
Bearish signal — CVD peak is falling (lower high) but price at the CVD peak is rising (higher high). Smart money distributing into strength.
Divergences are plotted as arrows at the bottom (bullish) or top (bearish) of the pane, and can be configured as Trading View alerts.
Key Settings
Group Setting Default Purpose
Core Session Reset Daily When the CVD counter resets to zero
EMA Period / Thickness / Colours 21 Trend filter
WMA Length / Thickness / Colours 14 Early-trend detection
Divergence Pivot Lookback 3 Sensitivity — lower = more signals, higher = fewer but stronger
Visual Delta Ratio Scale 1000 Adjusts ratio magnitude for readability
Visual Show/Hide toggles All on Turn off individual plots
Usage Tips
Divergence is most reliable at session extremes. Look for bullish divergence near session lows, bearish divergence near session highs.
Delta Ratio trending above zero while CVD rises = sustained buying absorption. Ratio falling but CVD flat/rising = selling into strength (potential distribution).
EMA & WMA cross. When WMA crosses above EMA while CVD is positive, momentum is accelerating. When they cross below, momentum is fading.
Combine with price structure. Divergence arrows are early signals — wait for a structural trigger (CHoCH, breakout of a prior swing) before entering.
Works on any timeframe. The CVD always builds from 1-minute data regardless of the chart timeframe, so you get the same delta foundation whether you're on a 15M, 1H, or 4H chart.
Alerts
Three built-in alert conditions:
Bull Divergence (CVD) — fires when a new bullish divergence pivot is detected
Bear Divergence (CVD) — fires when a new bearish divergence pivot is detected
New Session Reset — fires when CVD resets at the start of a new daily/weekly session
Version: 1.0
Pine Script: v6

כתב ויתור
המידע והפרסומים אינם מיועדים להיות, ואינם מהווים, ייעוץ או המלצה פיננסית, השקעתית, מסחרית או מכל סוג אחר המסופקת או מאושרת על ידי TradingView. קרא עוד ב־תנאי השימוש.
כתב ויתור
המידע והפרסומים אינם מיועדים להיות, ואינם מהווים, ייעוץ או המלצה פיננסית, השקעתית, מסחרית או מכל סוג אחר המסופקת או מאושרת על ידי TradingView. קרא עוד ב־תנאי השימוש.