OPEN-SOURCE SCRIPT
מעודכן VWAP Sigma Bands [Y.Algo]
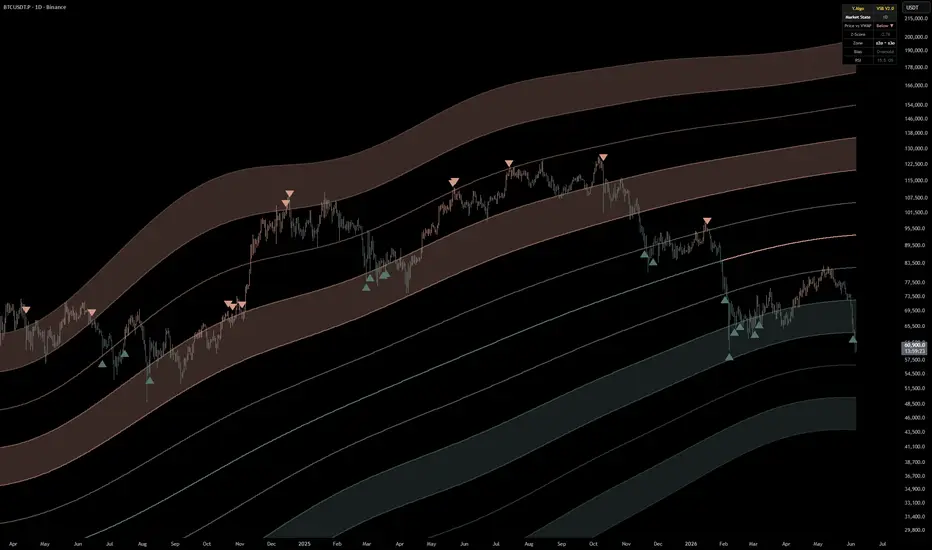
VWAP Sigma Bands [Y.Algo] — Rolling VWAP, 6-Layer Deviation Bands, HTF Engine & Market State Panel
VWAP Sigma Bands turns the volume-weighted fair-value line into a complete mean-reversion and trend framework. A continuously rolling VWAP acts as the equilibrium anchor, six graduated standard-deviation bands map how stretched price is on both sides, and a momentum-confirmed reversal engine plus an on-chart Market State panel let you read the whole picture at a glance — built for crypto, futures, stocks, forex and indices on any intraday-to-daily timeframe.
Fully open-source (CC BY-NC-SA 4.0) — every calculation is documented below and visible in the script.
🔶 USAGE
VWAP Sigma Bands is built around a "fair value → stretch → reversal" workflow. First read the VWAP midline: price trading above it favors longs, below it favors shorts, and a reclaim or loss of the line marks a regime shift. Next read the deviation bands: the inner zones are normal oscillation, the outer zones are statistically stretched areas where the odds of a snap-back rise. Finally, act on the reversal arrows, which only print when a band/line test lines up with an RSI momentum extreme.
Because every band is a potential support/resistance level, the indicator works equally well for two opposite styles. Mean-reversion traders fade the outer bands back toward VWAP; trend traders treat a decisive VWAP reclaim and an expanding band walk as continuation. The optional higher-timeframe engine lets a fast execution chart trade against a slower, more meaningful VWAP structure — for example reading the daily fair-value zones while entering on a 15-minute chart.
The Market State panel condenses all of this into one corner table — direction versus VWAP, the z-score (how many standard deviations price sits from fair value), the current zone, a composite bias, and RSI momentum status — so you get a same-side / overextended read without measuring anything by hand. Pair it with the alerts to be notified on VWAP crosses and confirmed reversals instead of watching the screen.
🔹 Rolling VWAP Midline
The core anchor is a continuously rolling volume-weighted average price (over the last 200 bars by default, using hlc3 as the price source), not a session-reset VWAP. Because it rolls over a fixed window it never resets at the daily open, so it behaves consistently on 24/7 markets like crypto and across every timeframe. The line auto-colors to your bull/bear theme depending on whether price is above or below it, giving an instant trend-bias read. Treat reclaims and losses of this line as the primary regime trigger.
🔹 6-Layer Standard Deviation Bands
Six bands are drawn above and below VWAP at one through six standard deviations (1σ–6σ), with graduated zone fills. σ is the volume-weighted standard deviation measured over the same rolling window as the VWAP. Inner layers contain normal, everyday oscillation, while the outer layers flag price stretched far from fair value, where mean-reversion probability climbs. Together they form a dynamic support/resistance grid that breathes with volatility — widening in fast markets, tightening in quiet ones. In linear mode each band is simply VWAP ± k·σ (symmetric). An optional geometric (log) mode instead plots VWAP × exp(±k·σ_rel) where σ_rel = σ / VWAP, making the bands asymmetric and proportional to percentage moves — the better fit for crypto and other high-volatility assets.
🔹 Higher-Timeframe Engine
You can compute the VWAP and σ from a higher timeframe and project that structure onto your current chart, so a lower-timeframe entry chart can trade against a more significant fair-value reference. Only the VWAP and σ series are pulled via request.security and the twelve bands are then rebuilt locally to stay efficient. A repaint toggle switches between a responsive realtime fetch (which can repaint) and a confirmed, lookahead-based fetch (no repaint). Optional smoothing applies a triple-EMA to the VWAP and σ; because EMA is a linear operator, smoothing the center and σ is mathematically equivalent to smoothing every band.
🔹 Momentum-Confirmed Reversal Arrows
Reversal triangles print only when two conditions align: price tests and rejects any band or the VWAP line (a touch within a tolerance, default 0.10σ, or a pierce that closes back), and RSI confirms momentum — by reaching overbought/oversold (default 70 / 30), crossing back out of those zones, or printing a regular RSI divergence (TradingView's standard pivot logic). This two-factor gate filters out the countless times price simply taps a band without reversing. An "extreme-outside" bypass keeps signals alive when price runs far beyond the outermost ±6σ band, and a pure band-cross mode (crossings of ±2σ to ±6σ) is available for traders who prefer raw crossings. Arrow size is adjustable.
🔹 RSI-Strength Bar Coloring
Each candle can be gradient-colored by RSI strength around the 50 midline like a thermometer: a deep bull tone when RSI is washed out and turning up, neutral grey in the middle, and a deep bear tone when RSI is overheated. This turns the entire price chart into a momentum heat map so you can see strengthening and weakening without opening a separate subchart.
🔹 Market State Panel
A compact on-chart table summarizes the current regime: price direction versus VWAP, the deviation z-score (close − VWAP) / σ, the active zone (core, inner, mid, or beyond), a composite bias (bullish, bearish, overbought-reversion or oversold-reversion), and live RSI momentum status. It is bilingual (Chinese / English), can be placed in any of the four chart corners, and offers four text sizes.
🔶 DETAILS
VWAP Sigma Bands is fully open-source (CC BY-NC-SA 4.0). Here is exactly how it works.
Fair value & bands — On every bar the script computes a rolling volume-weighted average price over the last N bars (default 200), using hlc3 as the price source. From the same window it derives the volume-weighted variance, Σ(vol·price²)/Σvol − VWAP², and takes its square root to get the standard deviation σ. Six band levels are drawn at 1σ through 6σ on each side. Linear mode = VWAP ± k·σ (symmetric); geometric (log) mode = VWAP × exp(±k·σ_rel) with σ_rel = σ / VWAP, giving asymmetric bands that scale with percentage moves.
Higher timeframe — With the HTF engine on, only the VWAP and σ series are resolved from the higher timeframe via request.security; the twelve bands are rebuilt locally. The repaint toggle chooses between a realtime fetch and a confirmed lookahead fetch. Optional smoothing applies a triple-EMA to the VWAP and σ — since EMA is linear, ema(VWAP ± k·σ) ≡ ema(VWAP) ± k·ema(σ), so smoothing the two series is equivalent to smoothing every band.
Reversal logic — The engine combines a location test with an RSI momentum read. Location is true when price touches within the tolerance (default 0.10σ) of any band or the midline, or pierces a line and closes back. Momentum is true on any of three events inside a lookback window (default 5 bars): RSI reaching overbought/oversold (default 70 / 30), RSI crossing back out of those zones, or a regular RSI divergence. When price is parked beyond the outermost ±6σ band, the extreme-outside bypass drops the location requirement and signals on momentum alone. A pure band-cross mode is available as an alternative.
Bar coloring & panel — Candle coloring is a gradient driven by RSI around the 50 midline. The panel's deviation score is the z-score (close − VWAP) / σ, which also drives the zone and bias readouts.
All visuals share a unified theme system (Classic Warm / Neon Cool / Custom), so VWAP Sigma Bands integrates cleanly with the rest of the Y.Algo suite.
🔶 SETTINGS
🔹 VWAP Settings
🔹 Higher Timeframe
🔹 Display Settings
🔹 RSI Reversal Filter
🔹 Market State Panel
🔹 Color Theme
🔹 Alerts
🔶 DISCLAIMER
This indicator and all its signals, markers, and alerts are provided for technical analysis study and research reference only. They do not constitute investment advice, financial advice, trading recommendations, or solicitations to buy or sell any asset. Financial market trading involves substantial risk; investors may lose part or all of their principal. Past performance does not represent and does not guarantee future results. All trading decisions made using this indicator are the sole responsibility of the user. The author and publishing platform assume no legal liability. Please fully understand market rules and your own risk tolerance, and consult a licensed professional financial advisor when necessary.
━━━━━━━━━━━━━━━━━━━━━━━━━━━━
中文版本 CHINESE VERSION
━━━━━━━━━━━━━━━━━━━━━━━━━━━━
VWAP Sigma Bands | VWAP 標準差帶 [Y.Algo] — 滾動 VWAP × 6 層標準差帶 × 高時間框架 × 市場狀態面板
VWAP Sigma Bands 把量價加權的公允價值線,升級成一套完整的均值回歸與順勢框架。持續滾動的 VWAP 作為平衡錨點,六層漸層標準差帶標示出價格在兩側偏離的程度,再搭配「動能確認反轉引擎」與圖上即時「市場狀態面板」,讓你一眼讀懂全局——適用加密貨幣、期貨、股票、外匯與指數,從當沖到日線各週期皆可套用。
完全開源(CC BY-NC-SA 4.0)——以下完整說明每一項計算,原始碼公開可查。
🔶 用途說明
VWAP Sigma Bands 圍繞「公允價值 → 偏離 → 反轉」的工作流設計。第一步先看 VWAP 中線:價格在線上偏多、線下偏空,而站回或跌破中線即代表盤勢轉換。第二步看標準差帶:內層是正常震盪區間,外層則是統計上明顯偏離的區域,回歸機率隨之升高。最後再依「反轉箭頭」行動——只有當價格測試某條帶線/中線、同時 RSI 動能來到極端時,箭頭才會出現。
由於每一條帶線都是潛在的支撐/壓力位,這支指標可同時服務兩種相反的風格。均值回歸者於外層帶反向佈局、預期價格回拉 VWAP;順勢者則把果斷站回 VWAP 與帶寬擴張的「沿帶推進」視為續勢。選用的高時間框架引擎,讓快速的執行圖能對照較慢、較具意義的 VWAP 結構——例如以日線公允價值區為背景,於 15 分鐘圖進場。
市場狀態面板把以上資訊濃縮進角落單一表格——價格相對 VWAP 的方向、偏離 Z 值(價格距公允價值幾個標準差)、目前所在區間、綜合偏向、以及 RSI 動能狀態——不必手動測量,就能取得「同向/過度延伸」的判讀。再搭配警報,即可在 VWAP 穿越與確認反轉時收到通知,不必盯盤。
🔹 滾動 VWAP 中線
核心錨點是「持續滾動」的量價加權平均(預設取最近 200 根、以 hlc3 為價格來源),而非每日重置的 session VWAP。因為它以固定窗口滾動、不在每日開盤歸零,所以在加密這類 24 小時市場與任何週期上行為都保持一致。中線會依價格位於其上或其下,自動套用多/空主題色,提供即時的趨勢偏向判讀。請把站回與跌破這條線,視為最主要的盤勢轉換觸發。
🔹 6 層標準差帶
VWAP 上下各畫出 1σ 至 6σ 共六層標準差帶,並以漸層填充區隔。σ 為與 VWAP 同一滾動窗口計算的「量價加權標準差」。內層涵蓋日常的正常震盪,外層則標示出遠離公允價值、回歸機率攀升的延伸區。整體形成一張會「呼吸」的動態支撐/壓力網——行情快時擴張、盤整時收窄。線性模式下每條帶即 VWAP ± k·σ(對稱);另提供幾何(對數)模式,改畫 VWAP × exp(±k·σ_rel),其中 σ_rel = σ / VWAP,使帶呈上下不對稱、貼合百分比波動,對加密及其他高波動標的的擬合遠優於對稱線性帶。
🔹 高時間框架引擎
你可以用較高週期的資料計算 VWAP 與 σ,並將該結構投影到當前圖表,讓較低週期的進場圖能對照更具份量的公允價值參考。僅 VWAP 與 σ 兩個序列透過 request.security 取得,十二條帶則於本地重建以維持效率。重繪開關可在「即時抓取(會重繪)」與「確認抓取(lookahead,不重繪)」之間切換。選用的平滑階段對 VWAP 與 σ 套用三重 EMA;由於 EMA 為線性算子,平滑中線與 σ 在數學上等同於平滑每一條帶。
🔹 動能確認反轉箭頭
反轉三角只在兩個條件同時成立時出現:價格測試並拒絕了任一帶線或 VWAP 中線(觸及容差內,預設 0.10σ,或刺穿後收回),且 RSI 確認動能——達到超買/超賣(預設 70 / 30)、自該區翻轉穿越、或出現常規 RSI 背離(採 TradingView 標準樞軸邏輯)。這道雙重閘門能濾掉價格只是輕觸帶線卻未真正反轉的大量雜訊。另設「極端在外」旁路:當價格遠離最外層 ±6σ 帶時仍能給出訊號;也保留純帶穿越模式(±2σ 至 ±6σ 的穿越)給偏好原始穿越的交易者。箭頭大小可調整。
🔹 RSI 強弱 K 棒著色
每根 K 棒可依 RSI 強弱(以 50 為中線)以漸層著色,宛如溫度計:RSI 極度衰竭並轉強時呈深多頭色、中性時為灰、過熱時呈深空頭色。整張價格圖因此化為一張動能熱力圖,不必另開副圖即可看出動能的增強與轉弱。
🔹 市場狀態面板
圖上一個精巧表格即時統整當前盤勢:價格相對 VWAP 的方向、偏離 Z 值 (close − VWAP) / σ、所在區間(核心、內層、中層或更外)、綜合偏向(偏多、偏空、超買回歸或超賣回歸)、以及即時 RSI 動能狀態。面板支援中/英雙語、可放置於四個圖角、並提供四種文字大小。
🔶 技術細節
VWAP Sigma Bands 完全開源(CC BY-NC-SA 4.0),以下完整說明運作方式。
公允價值與帶線——每根 K 棒計算最近 N 根(預設 200)、以 hlc3 為來源的滾動量價加權平均;自同一窗口推導量價加權變異數 Σ(vol·price²)/Σvol − VWAP²,開根號得標準差 σ。上下各畫 1σ 至 6σ 六層。線性模式 = VWAP ± k·σ(對稱);幾何(對數)模式 = VWAP × exp(±k·σ_rel),σ_rel = σ / VWAP,得到隨百分比波動縮放的不對稱帶。
高時間框架——開啟 HTF 引擎時,僅 VWAP 與 σ 序列以 request.security 自高週期解析,十二條帶於本地重建。重繪開關在即時抓取與確認 lookahead 抓取間擇一。選用平滑對 VWAP 與 σ 套三重 EMA——因 EMA 線性,ema(VWAP ± k·σ) ≡ ema(VWAP) ± k·ema(σ),故平滑兩序列等同平滑每條帶。
反轉邏輯——引擎結合「位置測試」與「RSI 動能判讀」。位置:價格觸及任一帶線或中線容差內(預設 0.10σ),或刺穿後收回。動能:於回看窗口內(預設 5 根)任一事件成立——RSI 達超買/超賣(預設 70 / 30)、RSI 自該區翻轉穿越、或常規 RSI 背離。當價格停留於最外層 ±6σ 之外時,「極端在外」旁路會略過位置條件、純以動能給訊號。另提供純帶穿越模式作為替代。
K 棒著色與面板——K 棒著色為以 50 為中線、由 RSI 驅動的漸層。面板偏離分數即 Z 值 (close − VWAP) / σ,亦同時驅動區間與偏向判讀。
所有視覺共用統一主題色系(經典暖色/霓虹冷色/自訂),可無縫融入 Y.Algo 全系列指標的視覺語言。
🔶 設定說明
🔹 VWAP 設定
🔹 高時間框架
🔹 顯示設定
🔹 RSI 反轉確認
🔹 市場狀態面板
🔹 顏色主題
🔹 警報
🔶 免責聲明
本指標及其所產生之所有信號、標記與警報,僅供技術分析學習與研究參考,不構成任何形式之投資建議、財務建議、交易推薦或買賣邀約。金融市場交易涉及高度風險,投資人可能損失部分或全部本金。過去表現不代表亦不保證未來結果。使用本指標之任何交易決策均由使用者自行判斷並承擔完全責任,作者與發布平台不負任何法律責任。請充分了解市場規則與自身風險承受能力,必要時諮詢具備合法資質的專業財務顧問。
VWAP Sigma Bands turns the volume-weighted fair-value line into a complete mean-reversion and trend framework. A continuously rolling VWAP acts as the equilibrium anchor, six graduated standard-deviation bands map how stretched price is on both sides, and a momentum-confirmed reversal engine plus an on-chart Market State panel let you read the whole picture at a glance — built for crypto, futures, stocks, forex and indices on any intraday-to-daily timeframe.
Fully open-source (CC BY-NC-SA 4.0) — every calculation is documented below and visible in the script.
🔶 USAGE
VWAP Sigma Bands is built around a "fair value → stretch → reversal" workflow. First read the VWAP midline: price trading above it favors longs, below it favors shorts, and a reclaim or loss of the line marks a regime shift. Next read the deviation bands: the inner zones are normal oscillation, the outer zones are statistically stretched areas where the odds of a snap-back rise. Finally, act on the reversal arrows, which only print when a band/line test lines up with an RSI momentum extreme.
Because every band is a potential support/resistance level, the indicator works equally well for two opposite styles. Mean-reversion traders fade the outer bands back toward VWAP; trend traders treat a decisive VWAP reclaim and an expanding band walk as continuation. The optional higher-timeframe engine lets a fast execution chart trade against a slower, more meaningful VWAP structure — for example reading the daily fair-value zones while entering on a 15-minute chart.
The Market State panel condenses all of this into one corner table — direction versus VWAP, the z-score (how many standard deviations price sits from fair value), the current zone, a composite bias, and RSI momentum status — so you get a same-side / overextended read without measuring anything by hand. Pair it with the alerts to be notified on VWAP crosses and confirmed reversals instead of watching the screen.
🔹 Rolling VWAP Midline
The core anchor is a continuously rolling volume-weighted average price (over the last 200 bars by default, using hlc3 as the price source), not a session-reset VWAP. Because it rolls over a fixed window it never resets at the daily open, so it behaves consistently on 24/7 markets like crypto and across every timeframe. The line auto-colors to your bull/bear theme depending on whether price is above or below it, giving an instant trend-bias read. Treat reclaims and losses of this line as the primary regime trigger.
🔹 6-Layer Standard Deviation Bands
Six bands are drawn above and below VWAP at one through six standard deviations (1σ–6σ), with graduated zone fills. σ is the volume-weighted standard deviation measured over the same rolling window as the VWAP. Inner layers contain normal, everyday oscillation, while the outer layers flag price stretched far from fair value, where mean-reversion probability climbs. Together they form a dynamic support/resistance grid that breathes with volatility — widening in fast markets, tightening in quiet ones. In linear mode each band is simply VWAP ± k·σ (symmetric). An optional geometric (log) mode instead plots VWAP × exp(±k·σ_rel) where σ_rel = σ / VWAP, making the bands asymmetric and proportional to percentage moves — the better fit for crypto and other high-volatility assets.
🔹 Higher-Timeframe Engine
You can compute the VWAP and σ from a higher timeframe and project that structure onto your current chart, so a lower-timeframe entry chart can trade against a more significant fair-value reference. Only the VWAP and σ series are pulled via request.security and the twelve bands are then rebuilt locally to stay efficient. A repaint toggle switches between a responsive realtime fetch (which can repaint) and a confirmed, lookahead-based fetch (no repaint). Optional smoothing applies a triple-EMA to the VWAP and σ; because EMA is a linear operator, smoothing the center and σ is mathematically equivalent to smoothing every band.
🔹 Momentum-Confirmed Reversal Arrows
Reversal triangles print only when two conditions align: price tests and rejects any band or the VWAP line (a touch within a tolerance, default 0.10σ, or a pierce that closes back), and RSI confirms momentum — by reaching overbought/oversold (default 70 / 30), crossing back out of those zones, or printing a regular RSI divergence (TradingView's standard pivot logic). This two-factor gate filters out the countless times price simply taps a band without reversing. An "extreme-outside" bypass keeps signals alive when price runs far beyond the outermost ±6σ band, and a pure band-cross mode (crossings of ±2σ to ±6σ) is available for traders who prefer raw crossings. Arrow size is adjustable.
🔹 RSI-Strength Bar Coloring
Each candle can be gradient-colored by RSI strength around the 50 midline like a thermometer: a deep bull tone when RSI is washed out and turning up, neutral grey in the middle, and a deep bear tone when RSI is overheated. This turns the entire price chart into a momentum heat map so you can see strengthening and weakening without opening a separate subchart.
🔹 Market State Panel
A compact on-chart table summarizes the current regime: price direction versus VWAP, the deviation z-score (close − VWAP) / σ, the active zone (core, inner, mid, or beyond), a composite bias (bullish, bearish, overbought-reversion or oversold-reversion), and live RSI momentum status. It is bilingual (Chinese / English), can be placed in any of the four chart corners, and offers four text sizes.
🔶 DETAILS
VWAP Sigma Bands is fully open-source (CC BY-NC-SA 4.0). Here is exactly how it works.
Fair value & bands — On every bar the script computes a rolling volume-weighted average price over the last N bars (default 200), using hlc3 as the price source. From the same window it derives the volume-weighted variance, Σ(vol·price²)/Σvol − VWAP², and takes its square root to get the standard deviation σ. Six band levels are drawn at 1σ through 6σ on each side. Linear mode = VWAP ± k·σ (symmetric); geometric (log) mode = VWAP × exp(±k·σ_rel) with σ_rel = σ / VWAP, giving asymmetric bands that scale with percentage moves.
Higher timeframe — With the HTF engine on, only the VWAP and σ series are resolved from the higher timeframe via request.security; the twelve bands are rebuilt locally. The repaint toggle chooses between a realtime fetch and a confirmed lookahead fetch. Optional smoothing applies a triple-EMA to the VWAP and σ — since EMA is linear, ema(VWAP ± k·σ) ≡ ema(VWAP) ± k·ema(σ), so smoothing the two series is equivalent to smoothing every band.
Reversal logic — The engine combines a location test with an RSI momentum read. Location is true when price touches within the tolerance (default 0.10σ) of any band or the midline, or pierces a line and closes back. Momentum is true on any of three events inside a lookback window (default 5 bars): RSI reaching overbought/oversold (default 70 / 30), RSI crossing back out of those zones, or a regular RSI divergence. When price is parked beyond the outermost ±6σ band, the extreme-outside bypass drops the location requirement and signals on momentum alone. A pure band-cross mode is available as an alternative.
Bar coloring & panel — Candle coloring is a gradient driven by RSI around the 50 midline. The panel's deviation score is the z-score (close − VWAP) / σ, which also drives the zone and bias readouts.
All visuals share a unified theme system (Classic Warm / Neon Cool / Custom), so VWAP Sigma Bands integrates cleanly with the rest of the Y.Algo suite.
🔶 SETTINGS
🔹 VWAP Settings
- VWAP Length: Lookback window for the rolling VWAP and σ (default 200); also sets band width.
- Show StdDev Bands: Toggles the six deviation bands on each side.
- Fill Bands: Toggles the graduated zone fills between bands.
- Geometric (Log) Bands: Switches from linear VWAP ± k·σ to log bands VWAP × exp(±k·σ_rel) that scale with percentage moves — better for crypto / high-volatility assets.
🔹 Higher Timeframe
- Use Chart Timeframe: Anchors VWAP to the current chart timeframe; disable to set a higher timeframe manually.
- Higher Timeframe: The timeframe used when "Use Chart Timeframe" is off.
- Enable HTF Compute: Resolves VWAP/σ from real higher-timeframe data instead of approximating on the chart.
- Allow HTF Repaint: On = realtime but repaints; Off = confirmed (lookahead), no repaint.
- Smooth HTF: Applies a triple-EMA to the higher-timeframe VWAP and σ.
- Smoothing Factor: Divisor controlling the smoothing window length (larger = shorter window).
🔹 Display Settings
- Show Reversal Signal Arrows: Toggles the reversal triangle markers.
- Reversal Arrow Size: Tiny / Small / Normal / Large.
- RSI-Strength Bar Coloring: Gradient-colors candles by RSI strength around 50 (thermometer).
🔹 RSI Reversal Filter
- Reversal = Near-Line + RSI: Two-factor reversal (line test + RSI momentum); turn off for pure band-cross signals.
- RSI Length: Lookback for the RSI (default 14).
- RSI Overbought: Level treated as overheated, bearish momentum (default 70).
- RSI Oversold: Level treated as washed-out, bullish momentum (default 30).
- Near-Line Tolerance (×σ): How close to a line counts as a test, in σ units (default 0.10).
- Momentum Window (bars): How long an RSI event stays valid to pair with a line test (default 5).
- Also Trigger on RSI Divergence: Lets a regular RSI divergence count as momentum confirmation.
- Divergence Pivot Length: Pivot left/right bars for divergence (default 5; larger = stricter and later).
- Extreme-Outside RSI-Only: When price runs beyond ±6σ, bypass the line condition and signal on RSI alone.
🔹 Market State Panel
- Show Market State Panel: Toggles the on-chart summary table.
- Panel Position: Top Right / Bottom Right / Top Left / Bottom Left.
- Panel Language: Chinese / English.
- Panel Size: Tiny / Small / Normal / Large.
🔹 Color Theme
- Color Theme: Classic Warm / Neon Cool / Custom.
- Bull / Lower & Bear / Upper Color: Custom band colors, active only in Custom theme.
🔹 Alerts
- VWAP Cross-Up Alert: Price crosses above the VWAP midline.
- VWAP Cross-Down Alert: Price crosses below the VWAP midline.
- Bullish Reversal Alert: A confirmed bullish reversal (line test + RSI momentum) prints.
- Bearish Reversal Alert: A confirmed bearish reversal (line test + RSI momentum) prints.
🔶 DISCLAIMER
This indicator and all its signals, markers, and alerts are provided for technical analysis study and research reference only. They do not constitute investment advice, financial advice, trading recommendations, or solicitations to buy or sell any asset. Financial market trading involves substantial risk; investors may lose part or all of their principal. Past performance does not represent and does not guarantee future results. All trading decisions made using this indicator are the sole responsibility of the user. The author and publishing platform assume no legal liability. Please fully understand market rules and your own risk tolerance, and consult a licensed professional financial advisor when necessary.
━━━━━━━━━━━━━━━━━━━━━━━━━━━━
中文版本 CHINESE VERSION
━━━━━━━━━━━━━━━━━━━━━━━━━━━━
VWAP Sigma Bands | VWAP 標準差帶 [Y.Algo] — 滾動 VWAP × 6 層標準差帶 × 高時間框架 × 市場狀態面板
VWAP Sigma Bands 把量價加權的公允價值線,升級成一套完整的均值回歸與順勢框架。持續滾動的 VWAP 作為平衡錨點,六層漸層標準差帶標示出價格在兩側偏離的程度,再搭配「動能確認反轉引擎」與圖上即時「市場狀態面板」,讓你一眼讀懂全局——適用加密貨幣、期貨、股票、外匯與指數,從當沖到日線各週期皆可套用。
完全開源(CC BY-NC-SA 4.0)——以下完整說明每一項計算,原始碼公開可查。
🔶 用途說明
VWAP Sigma Bands 圍繞「公允價值 → 偏離 → 反轉」的工作流設計。第一步先看 VWAP 中線:價格在線上偏多、線下偏空,而站回或跌破中線即代表盤勢轉換。第二步看標準差帶:內層是正常震盪區間,外層則是統計上明顯偏離的區域,回歸機率隨之升高。最後再依「反轉箭頭」行動——只有當價格測試某條帶線/中線、同時 RSI 動能來到極端時,箭頭才會出現。
由於每一條帶線都是潛在的支撐/壓力位,這支指標可同時服務兩種相反的風格。均值回歸者於外層帶反向佈局、預期價格回拉 VWAP;順勢者則把果斷站回 VWAP 與帶寬擴張的「沿帶推進」視為續勢。選用的高時間框架引擎,讓快速的執行圖能對照較慢、較具意義的 VWAP 結構——例如以日線公允價值區為背景,於 15 分鐘圖進場。
市場狀態面板把以上資訊濃縮進角落單一表格——價格相對 VWAP 的方向、偏離 Z 值(價格距公允價值幾個標準差)、目前所在區間、綜合偏向、以及 RSI 動能狀態——不必手動測量,就能取得「同向/過度延伸」的判讀。再搭配警報,即可在 VWAP 穿越與確認反轉時收到通知,不必盯盤。
🔹 滾動 VWAP 中線
核心錨點是「持續滾動」的量價加權平均(預設取最近 200 根、以 hlc3 為價格來源),而非每日重置的 session VWAP。因為它以固定窗口滾動、不在每日開盤歸零,所以在加密這類 24 小時市場與任何週期上行為都保持一致。中線會依價格位於其上或其下,自動套用多/空主題色,提供即時的趨勢偏向判讀。請把站回與跌破這條線,視為最主要的盤勢轉換觸發。
🔹 6 層標準差帶
VWAP 上下各畫出 1σ 至 6σ 共六層標準差帶,並以漸層填充區隔。σ 為與 VWAP 同一滾動窗口計算的「量價加權標準差」。內層涵蓋日常的正常震盪,外層則標示出遠離公允價值、回歸機率攀升的延伸區。整體形成一張會「呼吸」的動態支撐/壓力網——行情快時擴張、盤整時收窄。線性模式下每條帶即 VWAP ± k·σ(對稱);另提供幾何(對數)模式,改畫 VWAP × exp(±k·σ_rel),其中 σ_rel = σ / VWAP,使帶呈上下不對稱、貼合百分比波動,對加密及其他高波動標的的擬合遠優於對稱線性帶。
🔹 高時間框架引擎
你可以用較高週期的資料計算 VWAP 與 σ,並將該結構投影到當前圖表,讓較低週期的進場圖能對照更具份量的公允價值參考。僅 VWAP 與 σ 兩個序列透過 request.security 取得,十二條帶則於本地重建以維持效率。重繪開關可在「即時抓取(會重繪)」與「確認抓取(lookahead,不重繪)」之間切換。選用的平滑階段對 VWAP 與 σ 套用三重 EMA;由於 EMA 為線性算子,平滑中線與 σ 在數學上等同於平滑每一條帶。
🔹 動能確認反轉箭頭
反轉三角只在兩個條件同時成立時出現:價格測試並拒絕了任一帶線或 VWAP 中線(觸及容差內,預設 0.10σ,或刺穿後收回),且 RSI 確認動能——達到超買/超賣(預設 70 / 30)、自該區翻轉穿越、或出現常規 RSI 背離(採 TradingView 標準樞軸邏輯)。這道雙重閘門能濾掉價格只是輕觸帶線卻未真正反轉的大量雜訊。另設「極端在外」旁路:當價格遠離最外層 ±6σ 帶時仍能給出訊號;也保留純帶穿越模式(±2σ 至 ±6σ 的穿越)給偏好原始穿越的交易者。箭頭大小可調整。
🔹 RSI 強弱 K 棒著色
每根 K 棒可依 RSI 強弱(以 50 為中線)以漸層著色,宛如溫度計:RSI 極度衰竭並轉強時呈深多頭色、中性時為灰、過熱時呈深空頭色。整張價格圖因此化為一張動能熱力圖,不必另開副圖即可看出動能的增強與轉弱。
🔹 市場狀態面板
圖上一個精巧表格即時統整當前盤勢:價格相對 VWAP 的方向、偏離 Z 值 (close − VWAP) / σ、所在區間(核心、內層、中層或更外)、綜合偏向(偏多、偏空、超買回歸或超賣回歸)、以及即時 RSI 動能狀態。面板支援中/英雙語、可放置於四個圖角、並提供四種文字大小。
🔶 技術細節
VWAP Sigma Bands 完全開源(CC BY-NC-SA 4.0),以下完整說明運作方式。
公允價值與帶線——每根 K 棒計算最近 N 根(預設 200)、以 hlc3 為來源的滾動量價加權平均;自同一窗口推導量價加權變異數 Σ(vol·price²)/Σvol − VWAP²,開根號得標準差 σ。上下各畫 1σ 至 6σ 六層。線性模式 = VWAP ± k·σ(對稱);幾何(對數)模式 = VWAP × exp(±k·σ_rel),σ_rel = σ / VWAP,得到隨百分比波動縮放的不對稱帶。
高時間框架——開啟 HTF 引擎時,僅 VWAP 與 σ 序列以 request.security 自高週期解析,十二條帶於本地重建。重繪開關在即時抓取與確認 lookahead 抓取間擇一。選用平滑對 VWAP 與 σ 套三重 EMA——因 EMA 線性,ema(VWAP ± k·σ) ≡ ema(VWAP) ± k·ema(σ),故平滑兩序列等同平滑每條帶。
反轉邏輯——引擎結合「位置測試」與「RSI 動能判讀」。位置:價格觸及任一帶線或中線容差內(預設 0.10σ),或刺穿後收回。動能:於回看窗口內(預設 5 根)任一事件成立——RSI 達超買/超賣(預設 70 / 30)、RSI 自該區翻轉穿越、或常規 RSI 背離。當價格停留於最外層 ±6σ 之外時,「極端在外」旁路會略過位置條件、純以動能給訊號。另提供純帶穿越模式作為替代。
K 棒著色與面板——K 棒著色為以 50 為中線、由 RSI 驅動的漸層。面板偏離分數即 Z 值 (close − VWAP) / σ,亦同時驅動區間與偏向判讀。
所有視覺共用統一主題色系(經典暖色/霓虹冷色/自訂),可無縫融入 Y.Algo 全系列指標的視覺語言。
🔶 設定說明
🔹 VWAP 設定
- VWAP 計算長度:滾動 VWAP 與 σ 的回看窗口(預設 200),亦決定帶寬。
- 顯示標準差帶:開關上下各六層標準差帶。
- 填充標準差帶:開關帶與帶之間的漸層區塊填充。
- 幾何 (對數) 帶:由線性 VWAP ± k·σ 切換為隨百分比波動縮放的對數帶 VWAP × exp(±k·σ_rel)——更適合加密/高波動標的。
🔹 高時間框架
- 使用圖表時間框架:將 VWAP 錨定於當前圖表週期;關閉後可於下方手動指定高週期。
- 高時間框架:當「使用圖表時間框架」關閉時所採用的週期。
- 啟用高時間框架運算:以真實高週期資料解析 VWAP/σ,而非於本圖近似估算。
- 允許高時間框架重繪:開=即時但會重繪;關=確認(lookahead)、不重繪。
- 平滑高時間框架:對高週期 VWAP 與 σ 套用三重 EMA。
- 平滑因子:作為除數,控制平滑窗口長度(越大窗口越短)。
🔹 顯示設定
- 顯示反轉訊號箭頭:開關反轉三角標記。
- 反轉箭頭大小:極小/小/正常/大。
- RSI 強弱 K 棒著色:依 RSI 強弱(以 50 為中線)以漸層著色 K 棒(溫度計)。
🔹 RSI 反轉確認
- 反轉=接近線 + RSI 動能:位置測試+RSI 動能的雙重反轉;關閉則為純帶穿越訊號。
- RSI 長度:RSI 的回看長度(預設 14)。
- RSI 超買門檻:判定為過熱、空頭動能的水準(預設 70)。
- RSI 超賣門檻:判定為超賣、多頭動能的水準(預設 30)。
- 接近線容差 (×σ):距帶線多近仍算作測試,以 σ 為單位(預設 0.10)。
- 動能確認窗 (根):RSI 事件可保持有效、用以搭配位置測試的根數(預設 5)。
- RSI 背離也觸發:讓常規 RSI 背離也計為動能確認。
- 背離樞軸長度:背離偵測的樞軸左右根數(預設 5;越大越嚴格、確認越晚)。
- 極端在外純看 RSI:價格遠離 ±6σ 時,略過位置條件,純以 RSI 給出訊號。
🔹 市場狀態面板
- 顯示市場狀態面板:開關圖上的狀態統整表。
- 面板位置:右上/右下/左上/左下。
- 面板語言:中文/English。
- 面板大小:極小/小/正常/大。
🔹 顏色主題
- 顏色主題:經典暖色/霓虹冷色/自訂。
- 多頭 / 下軌色與空頭 / 上軌色:自訂帶色,僅於自訂主題時生效。
🔹 警報
- VWAP 上穿警報:價格上穿 VWAP 中線。
- VWAP 下穿警報:價格下穿 VWAP 中線。
- 多頭反轉警報:出現確認的多頭反轉(接近線+RSI 動能)。
- 空頭反轉警報:出現確認的空頭反轉(接近線+RSI 動能)。
🔶 免責聲明
本指標及其所產生之所有信號、標記與警報,僅供技術分析學習與研究參考,不構成任何形式之投資建議、財務建議、交易推薦或買賣邀約。金融市場交易涉及高度風險,投資人可能損失部分或全部本金。過去表現不代表亦不保證未來結果。使用本指標之任何交易決策均由使用者自行判斷並承擔完全責任,作者與發布平台不負任何法律責任。請充分了解市場規則與自身風險承受能力,必要時諮詢具備合法資質的專業財務顧問。
הערות שחרור
update the chartסקריפט קוד פתוח
ברוח האמיתית של TradingView, יוצר הסקריפט הזה הפך אותו לקוד פתוח, כך שסוחרים יוכלו לעיין בו ולאמת את פעולתו. כל הכבוד למחבר! אמנם ניתן להשתמש בו בחינם, אך זכור כי פרסום חוזר של הקוד כפוף ל־כללי הבית שלנו.

כתב ויתור
המידע והפרסומים אינם מיועדים להיות, ואינם מהווים, ייעוץ או המלצה פיננסית, השקעתית, מסחרית או מכל סוג אחר המסופקת או מאושרת על ידי TradingView. קרא עוד ב־תנאי השימוש.
סקריפט קוד פתוח
ברוח האמיתית של TradingView, יוצר הסקריפט הזה הפך אותו לקוד פתוח, כך שסוחרים יוכלו לעיין בו ולאמת את פעולתו. כל הכבוד למחבר! אמנם ניתן להשתמש בו בחינם, אך זכור כי פרסום חוזר של הקוד כפוף ל־כללי הבית שלנו.
כתב ויתור
המידע והפרסומים אינם מיועדים להיות, ואינם מהווים, ייעוץ או המלצה פיננסית, השקעתית, מסחרית או מכל סוג אחר המסופקת או מאושרת על ידי TradingView. קרא עוד ב־תנאי השימוש.