OPEN-SOURCE SCRIPT
מעודכן Volatility Regime Dashboard
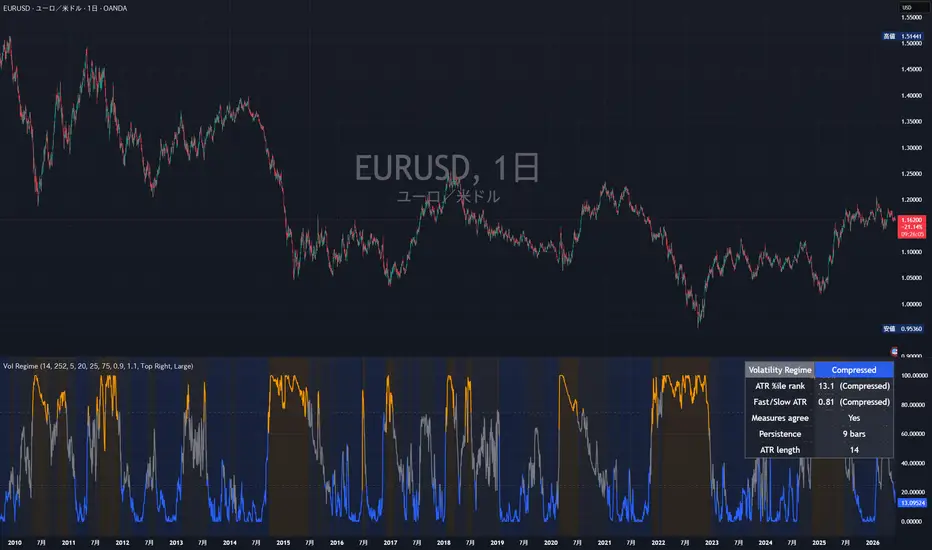
## Overview
Volatility Regime Dashboard is a context and visualization tool that classifies the
current volatility state of any symbol as **Compressed**, **Normal**, or **Expanded**.
Instead of plotting a single raw volatility line, it combines two independent
normalized measures and only changes the displayed state when both of them agree.
A compact table reports the underlying numbers and how many bars the current regime
has lasted.
This script is a visualization and context tool. It does not generate buy or sell
signals. It does not provide financial advice and makes no performance, accuracy,
or future-result claims.
## What it visualizes
- A line in its own pane showing the **percentile rank of price-normalized ATR**
(0-100), with dashed guides at the compressed and expanded thresholds and a
dotted midline.
- A **regime background shade** (optional) coloring the pane by the current state.
- A **context table** with the regime name, the ATR percentile value, the
Fast/Slow ATR compression ratio, whether the two measures currently agree, the
regime persistence in bars, and the ATR length in use.
## How it works
Two measures are computed independently:
1. **Price-normalized ATR percentile.** ATR is divided by price (so the measure is
comparable across symbols and price levels), then ranked as a percentile over a
user-defined lookback (default 252 bars). A high percentile means current ATR is
large relative to its own recent history; a low percentile means it is small.
2. **Fast/Slow ATR compression ratio.** A fast-window ATR is divided by a
slow-window ATR. A ratio above 1 means range is expanding relative to its
baseline; below 1 means it is compressing.
Each measure is classified into Compressed (-1), Normal (0), or Expanded (+1) using
its own thresholds. The displayed regime uses **hysteresis**: it flips to Expanded
or Compressed only when **both** measures agree on that direction, returns to Normal
only when both measures sit in their middle bands, and otherwise **holds** the prior
regime while the two measures disagree. This reduces flicker compared with reacting
to either measure alone. A persistence counter tracks how many consecutive bars the
current regime has held.
## How to use it
- Read the regime as **situational context** about how active the market currently
is relative to its own recent behavior, not as an instruction to act.
- Watch the percentile line approach the dashed thresholds to anticipate when a
regime change may be confirmed by both measures.
- Use the persistence counter to gauge whether a regime is freshly established or
well established.
- Adjust the lookback and thresholds to match the symbol and timeframe you study;
the defaults suit daily charts and are a starting point, not an optimized set.
## What makes it original
Most volatility tools plot a single raw or smoothed value. This dashboard derives a
**single discrete regime from the agreement of two structurally different measures**
- a within-history percentile rank and a fast-versus-slow ratio - and gates state
changes with hysteresis so the regime persists through brief disagreement. It then
surfaces the **persistence duration** of the current regime. The combination of
cross-measure agreement, hysteresis, and persistence reporting is the contribution;
it is not a re-skin of a built-in ATR, Bollinger, or standard-deviation indicator.
## What it does not do
- Does not generate buy/sell signals.
- Does not give entry/exit, target-level, or position-sizing instructions.
- Does not predict price or forecast performance.
- Does not run a strategy or backtest.
- Does not place or manage orders for you.
## Limitations
- Volatility regime is **descriptive context**, not a forecast; an Expanded or
Compressed state can persist or reverse at any time.
- The percentile rank depends on the lookback window; very small lookbacks make the
state noisy and very large ones make it slow to update.
- On symbols or timeframes with sparse history, the percentile may be unstable until
enough bars are available.
- ATR divided by price assumes price is positive and non-zero; exotic data feeds may
behave unexpectedly.
- Default thresholds are reasonable starting values, not values tuned for any
particular market.
## Suggested chart setup
- Use a liquid, recognizable symbol on a daily timeframe so the percentile lookback
has enough history.
- Keep the chart clean: this indicator opens in its own pane, so remove unrelated
indicators and let the percentile line, threshold guides, regime background, and
table be clearly visible.
- Make sure the indicator name, symbol, and timeframe are visible in any published
screenshot.
---
## Japanese notes / 日本語補足
このスクリプトはボラティリティの状態を「Compressed(収縮)」「Normal(通常)」
「Expanded(拡大)」として表示する、コンテキスト把握用の可視化ツールです。価格で
正規化したATRのパーセンタイル順位と、ファスト/スロー期間のATR比率という2つの独立
した指標を用い、両者が一致したときだけ状態を変更するヒステリシス方式を採用していま
す。表には各指標の数値と、現在の状態が何本のバー継続しているかを表示します。
これは相場の状況を把握するための可視化ツールであり、売買の指示は行いません。投資
助言ではなく、将来の値動きや運用成績に関する主張も一切行いません。新規の建玉や手
仕舞い、ポジションサイズの提案も行いません。しきい値やルックバックは銘柄や時間足に
合わせて調整してください(初期値は最適化されたものではありません)。
Volatility Regime Dashboard is a context and visualization tool that classifies the
current volatility state of any symbol as **Compressed**, **Normal**, or **Expanded**.
Instead of plotting a single raw volatility line, it combines two independent
normalized measures and only changes the displayed state when both of them agree.
A compact table reports the underlying numbers and how many bars the current regime
has lasted.
This script is a visualization and context tool. It does not generate buy or sell
signals. It does not provide financial advice and makes no performance, accuracy,
or future-result claims.
## What it visualizes
- A line in its own pane showing the **percentile rank of price-normalized ATR**
(0-100), with dashed guides at the compressed and expanded thresholds and a
dotted midline.
- A **regime background shade** (optional) coloring the pane by the current state.
- A **context table** with the regime name, the ATR percentile value, the
Fast/Slow ATR compression ratio, whether the two measures currently agree, the
regime persistence in bars, and the ATR length in use.
## How it works
Two measures are computed independently:
1. **Price-normalized ATR percentile.** ATR is divided by price (so the measure is
comparable across symbols and price levels), then ranked as a percentile over a
user-defined lookback (default 252 bars). A high percentile means current ATR is
large relative to its own recent history; a low percentile means it is small.
2. **Fast/Slow ATR compression ratio.** A fast-window ATR is divided by a
slow-window ATR. A ratio above 1 means range is expanding relative to its
baseline; below 1 means it is compressing.
Each measure is classified into Compressed (-1), Normal (0), or Expanded (+1) using
its own thresholds. The displayed regime uses **hysteresis**: it flips to Expanded
or Compressed only when **both** measures agree on that direction, returns to Normal
only when both measures sit in their middle bands, and otherwise **holds** the prior
regime while the two measures disagree. This reduces flicker compared with reacting
to either measure alone. A persistence counter tracks how many consecutive bars the
current regime has held.
## How to use it
- Read the regime as **situational context** about how active the market currently
is relative to its own recent behavior, not as an instruction to act.
- Watch the percentile line approach the dashed thresholds to anticipate when a
regime change may be confirmed by both measures.
- Use the persistence counter to gauge whether a regime is freshly established or
well established.
- Adjust the lookback and thresholds to match the symbol and timeframe you study;
the defaults suit daily charts and are a starting point, not an optimized set.
## What makes it original
Most volatility tools plot a single raw or smoothed value. This dashboard derives a
**single discrete regime from the agreement of two structurally different measures**
- a within-history percentile rank and a fast-versus-slow ratio - and gates state
changes with hysteresis so the regime persists through brief disagreement. It then
surfaces the **persistence duration** of the current regime. The combination of
cross-measure agreement, hysteresis, and persistence reporting is the contribution;
it is not a re-skin of a built-in ATR, Bollinger, or standard-deviation indicator.
## What it does not do
- Does not generate buy/sell signals.
- Does not give entry/exit, target-level, or position-sizing instructions.
- Does not predict price or forecast performance.
- Does not run a strategy or backtest.
- Does not place or manage orders for you.
## Limitations
- Volatility regime is **descriptive context**, not a forecast; an Expanded or
Compressed state can persist or reverse at any time.
- The percentile rank depends on the lookback window; very small lookbacks make the
state noisy and very large ones make it slow to update.
- On symbols or timeframes with sparse history, the percentile may be unstable until
enough bars are available.
- ATR divided by price assumes price is positive and non-zero; exotic data feeds may
behave unexpectedly.
- Default thresholds are reasonable starting values, not values tuned for any
particular market.
## Suggested chart setup
- Use a liquid, recognizable symbol on a daily timeframe so the percentile lookback
has enough history.
- Keep the chart clean: this indicator opens in its own pane, so remove unrelated
indicators and let the percentile line, threshold guides, regime background, and
table be clearly visible.
- Make sure the indicator name, symbol, and timeframe are visible in any published
screenshot.
---
## Japanese notes / 日本語補足
このスクリプトはボラティリティの状態を「Compressed(収縮)」「Normal(通常)」
「Expanded(拡大)」として表示する、コンテキスト把握用の可視化ツールです。価格で
正規化したATRのパーセンタイル順位と、ファスト/スロー期間のATR比率という2つの独立
した指標を用い、両者が一致したときだけ状態を変更するヒステリシス方式を採用していま
す。表には各指標の数値と、現在の状態が何本のバー継続しているかを表示します。
これは相場の状況を把握するための可視化ツールであり、売買の指示は行いません。投資
助言ではなく、将来の値動きや運用成績に関する主張も一切行いません。新規の建玉や手
仕舞い、ポジションサイズの提案も行いません。しきい値やルックバックは銘柄や時間足に
合わせて調整してください(初期値は最適化されたものではありません)。
הערות שחרור
One-line release noteDisplay-only update: the on-chart info table now uses a larger, configurable font and explicit high-contrast colors so the panel is easier to read. No change to calculations, outputs, classification logic, or alerts.
What changed
Configurable table font size. Added a "Table text size" dropdown (Small / Normal / Large / Huge, default Large) in the existing Display input group. Previously every table cell used a hardcoded size.small; all cells are now driven by this single setting.
Improved legibility / contrast. Every data row of the table now sets an explicit text color (white) and cell background (dark slate #1e222d for the label column, #2a2e39 for the value column). Previously only the two header cells were colored, so the remaining cells inherited the chart theme's defaults and could be low-contrast on some themes. The header cells were made slightly more solid (lower transparency) and the table frame was made a little more prominent (frame_width 1 → 2).
Purpose / rationale
The information panel was reported as too small and hard to read on some screens and chart themes. The goal of this revision is purely readability and accessibility: a default size that is legible out of the box, a user control to adjust it, and fixed colors that hold their contrast under both light and dark chart themes.
Result / user-visible effect
The regime panel is clearly legible by default and can be resized by the user. The numbers, states, and behavior it reports are identical to the previous version — only their presentation changed.
Scope & compliance notes (for moderation / internal audit / House Rules)
Display-only change. The analytical core is untouched and byte-for-byte reproducible: the price-normalized ATR percentile rank, the fast/slow ATR compression ratio, the per-measure states, the agreement/hysteresis regime logic, and the persistence counter are all unchanged. Identical inputs produce identical values.
Still an analysis / visualization study. The script does not generate buy/sell signals, entries, exits, targets, or position sizing, and it does not place orders or auto-trade. This update adds none of those.
No performance or future-result claims. Nothing in the code or in this update states, implies, or guarantees profit, accuracy, win rate, or any future outcome.
Alerts unchanged and neutral. The single alertcondition remains a factual state-change notification ("Volatility regime changed"). It is informational only and is not a recommendation or instruction to trade.
Disclaimer retained. The in-code header disclaimer ("context/visualization tool only … Not financial advice") is kept verbatim.
Description stays accurate. The script's category, pane type, and stated function are unchanged, so the published title and description remain truthful and self-consistent — consistent with TradingView House Rules principles (clear, accurate, non-misleading, no guaranteed outcomes, no solicitation).
What did NOT change
indicator() declaration · overlay=false · all Measures and Thresholds inputs · Measure 1 (ATR/close percentile rank) · Measure 2 (fast/slow ATR ratio) · per-measure state · agreement · hysteresis regime · persistence counter · plot, hlines, and regime background shading · the alertcondition · the header disclaimer.
日本語
一行リリースノート
表示のみの更新です。チャート上の情報テーブルのフォントを大きく・サイズ可変に し、明示的な高コントラスト配色を適用して可読性を向上しました。計算・出力・ 判定ロジック・アラートに変更はありません。
変更内容
テーブル文字サイズの可変化。 既存の Display(表示)入力グループに 「Table text size」ドロップダウン(Small / Normal / Large / Huge、既定は Large)を追加しました。従来は各セルが size.small 固定でしたが、 この設定一つで全セルのサイズを制御します。
可読性・コントラストの改善。 テーブルの全データ行に、明示的な文字色 (白)とセル背景色(ラベル列=濃いスレート #1e222d、値列=#2a2e39)を 設定しました。従来はヘッダー2セルのみ配色されており、残りのセルはチャート テーマの既定色を継承するため、テーマによってはコントラストが低下していま した。あわせてヘッダーをやや濃く(透明度を下げる)し、テーブル枠線を少し 強調しました(frame_width 1 → 2)。
目的・意図
情報パネルが「小さすぎて、画面やチャートテーマによっては読みづらい」との指摘 がありました。本改訂の目的は純粋に可読性とアクセシビリティの向上です。 既定で十分に読めるサイズ、利用者が調整できるコントロール、そしてライト/ダーク いずれのテーマでもコントラストを保つ固定配色を提供します。
結果・利用者から見た変化
レジームパネルが既定で明瞭に読め、利用者がサイズを変更できるようになりました。 表示される数値・状態・挙動は従来版と同一で、変わったのは見せ方のみです。
範囲・コンプライアンス上の注記(モデレーション/内部監査/規約の観点)
表示のみの変更です。 分析の中核には一切手を加えておらず、再現性も完全 です。価格正規化 ATR のパーセンタイル順位、ファスト/スロー ATR の圧縮比、 各指標の状態、合意・ヒステリシスによるレジーム判定、継続バー数のカウンター はすべて不変です。同一の入力からは同一の値が得られます。
引き続き分析・可視化スタディです。 本スクリプトは売買シグナル・エントリー ・エグジット・目標値・建玉サイズを生成しません。発注も自動売買も行いま せん。本更新でこれらを追加してもいません。
成績・将来の結果に関する主張はありません。 コードにも本更新にも、利益・ 的中率・勝率・将来の成果を述べたり、示唆したり、保証したりする記述はありま せん。
アラートは不変かつ中立です。 唯一の alertcondition は事実としての状態 変化の通知("Volatility regime changed")のままです。情報提供のみであり、 売買の推奨・指示ではありません。
免責表示を維持。 コード冒頭の免責(「文脈・可視化ツールのみ … 投資助言 ではありません」)はそのまま保持しています。
説明文の正確性は維持。 スクリプトの種別・ペイン種別・記載された機能は 変わらないため、公開タイトルと説明は引き続き正確で整合しています。これは TradingView ハウスルールの原則(明確・正確・誤解を招かない・成果を保証しない ・勧誘を行わない)に沿うものです。
変更していない箇所
indicator() 宣言 · overlay=false · Measures と Thresholds の全入力 · 測度1(ATR/close のパーセンタイル順位)· 測度2(ファスト/スロー ATR 比)· 各指標の状態 · 合意判定 · ヒステリシス・レジーム · 継続カウンター · plot・hline・レジーム背景シェーディング · alertcondition · 冒頭の免責表示。
הערות שחרור
Display and alert update only. The calculations, classification logic, and outputs are unchanged.- Table text size is now selectable (Small / Normal / Large / Huge); the default is Large.
- Table text, label, and value background colors are now inputs. The default is a high-contrast dark panel that stays readable on any chart theme, and can be set to light colors if you prefer.
- Added an "Alert only on bar close" option, on by default, so the regime-change alert cannot fire intrabar and then revert before the bar closes.
- Threshold and length inputs are now validated. The script stops with a clear message if a "compressed below" value is not below its "expanded above" value, or if Fast ATR length is not below Slow ATR length.
- The table now shows a dash instead of "NaN" until enough history is available, and the percentile measure guards against a zero price.
הערות שחרור
Display and alert update only; calculations, logic, and outputs are unchanged.- Context table now has show/hide, compact, text-size, and color options.
- Shows "Warming up" (and "—" for persistence) until there is enough history, instead of defaulting to Normal.
- New "Alert only on bar close" option, default on, so a regime-change alert can't flicker intrabar and then revert.
- Threshold and length inputs are validated, and the table shows a dash instead of "NaN".
סקריפט קוד פתוח
ברוח האמיתית של TradingView, יוצר הסקריפט הזה הפך אותו לקוד פתוח, כך שסוחרים יוכלו לעיין בו ולאמת את פעולתו. כל הכבוד למחבר! אמנם ניתן להשתמש בו בחינם, אך זכור כי פרסום חוזר של הקוד כפוף ל־כללי הבית שלנו.

כתב ויתור
המידע והפרסומים אינם מיועדים להיות, ואינם מהווים, ייעוץ או המלצה פיננסית, השקעתית, מסחרית או מכל סוג אחר המסופקת או מאושרת על ידי TradingView. קרא עוד ב־תנאי השימוש.
סקריפט קוד פתוח
ברוח האמיתית של TradingView, יוצר הסקריפט הזה הפך אותו לקוד פתוח, כך שסוחרים יוכלו לעיין בו ולאמת את פעולתו. כל הכבוד למחבר! אמנם ניתן להשתמש בו בחינם, אך זכור כי פרסום חוזר של הקוד כפוף ל־כללי הבית שלנו.
כתב ויתור
המידע והפרסומים אינם מיועדים להיות, ואינם מהווים, ייעוץ או המלצה פיננסית, השקעתית, מסחרית או מכל סוג אחר המסופקת או מאושרת על ידי TradingView. קרא עוד ב־תנאי השימוש.