OPEN-SOURCE SCRIPT
Footprint Liquidity Imbalance Framework [PakunFX]
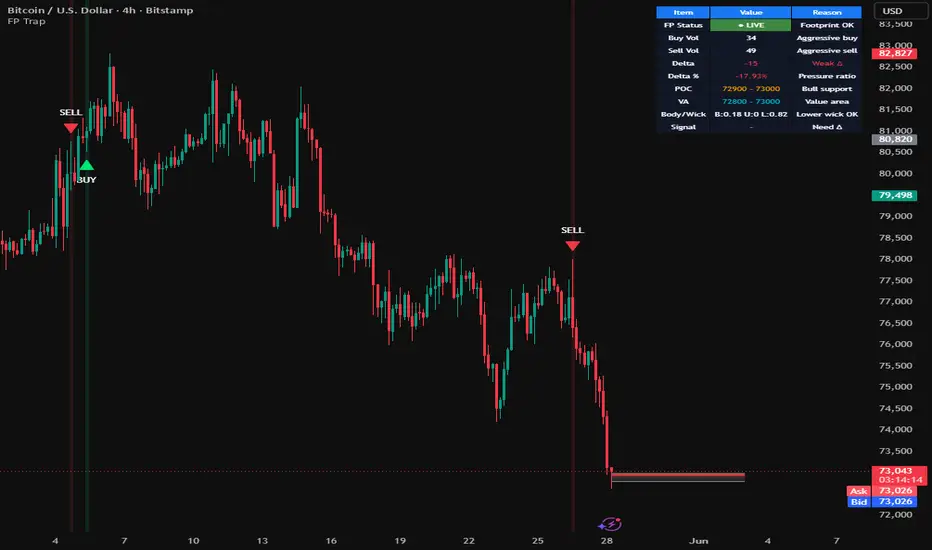
Footprint Liquidity Imbalance Framework [PakunFX]

Footprint Liquidity Imbalance Framework is a structural market analysis tool designed to visualize liquidity imbalance behavior using footprint delta, candle rejection structure, and contextual price positioning.
The framework focuses on identifying situations where aggressive participation is absorbed or rejected, helping traders observe potential liquidity interaction and liquidity interaction zones.
This script is intended for educational and analytical purposes only.
━━━━━━━━━━━━━━━━━━
■ Core Framework
The framework combines multiple analytical layers including:
Rather than functioning as a standalone prediction system, the script is designed to help traders visually interpret changing market participation conditions.
━━━━━━━━━━━━━━━━━━
■ Delta Imbalance Analysis

The script evaluates abnormal delta expansion relative to historical delta behavior.
Positive and negative delta conditions are analyzed together with candle structure in order to identify potential absorption behavior rather than simple directional momentum.
This framework focuses on situations where aggressive market participation may show reduced directional continuation.
━━━━━━━━━━━━━━━━━━
■ Candle Rejection Structure

The framework evaluates:
These conditions are used as structural context filters to reduce weak imbalance conditions.
━━━━━━━━━━━━━━━━━━
■ POC and Value Area Context

The script dynamically visualizes:
These areas are used as contextual liquidity reference zones rather than predictive levels.
The framework is designed to help traders understand how price interacts with active liquidity concentration areas.
━━━━━━━━━━━━━━━━━━
■ Contextual Market Layer

The displayed markers represent contextual imbalance conditions derived from:
These markers are intended as analytical references and should not be interpreted as predictive outcomes.
━━━━━━━━━━━━━━━━━━
■ Intended Usage

This framework is designed for traders interested in:
Recommended usage includes high-liquidity markets and structure-based analytical environments.
━━━━━━━━━━━━━━━━━━
■ Notes
Footprint Liquidity Imbalance Framework is a structural market analysis tool designed to visualize liquidity imbalance behavior using footprint delta, candle rejection structure, and contextual price positioning.
The framework focuses on identifying situations where aggressive participation is absorbed or rejected, helping traders observe potential liquidity interaction and liquidity interaction zones.
This script is intended for educational and analytical purposes only.
━━━━━━━━━━━━━━━━━━
■ Core Framework
The framework combines multiple analytical layers including:
- Footprint delta imbalance
- Candle rejection structure
- POC positioning
- Value Area context
- Volatility-adjusted imbalance conditions
Rather than functioning as a standalone prediction system, the script is designed to help traders visually interpret changing market participation conditions.
━━━━━━━━━━━━━━━━━━
■ Delta Imbalance Analysis
The script evaluates abnormal delta expansion relative to historical delta behavior.
Positive and negative delta conditions are analyzed together with candle structure in order to identify potential absorption behavior rather than simple directional momentum.
This framework focuses on situations where aggressive market participation may show reduced directional continuation.
━━━━━━━━━━━━━━━━━━
■ Candle Rejection Structure
The framework evaluates:
- Upper wick rejection
- Lower wick rejection
- Body-to-range ratio
- Relative candle acceptance behavior
These conditions are used as structural context filters to reduce weak imbalance conditions.
━━━━━━━━━━━━━━━━━━
■ POC and Value Area Context
The script dynamically visualizes:
- Point of Control (POC)
- Value Area High (VAH)
- Value Area Low (VAL)
These areas are used as contextual liquidity reference zones rather than predictive levels.
The framework is designed to help traders understand how price interacts with active liquidity concentration areas.
━━━━━━━━━━━━━━━━━━
■ Contextual Market Layer
The displayed markers represent contextual imbalance conditions derived from:
- Delta behavior
- Price rejection structure
- POC positioning
- Relative candle acceptance
These markers are intended as analytical references and should not be interpreted as predictive outcomes.
━━━━━━━━━━━━━━━━━━
■ Intended Usage
This framework is designed for traders interested in:
- Liquidity analysis
- Footprint behavior
- Market structure context
- Volume imbalance observation
- Discretionary analysis workflows
Recommended usage includes high-liquidity markets and structure-based analytical environments.
━━━━━━━━━━━━━━━━━━
■ Notes
- This script is intended for educational and structural analysis purposes.
- Results may vary depending on market conditions and timeframe selection.
- The framework does not guarantee profitability or predictive accuracy.
- This tool should be used as part of a broader analytical process.
סקריפט קוד פתוח
ברוח האמיתית של TradingView, יוצר הסקריפט הזה הפך אותו לקוד פתוח, כך שסוחרים יוכלו לעיין בו ולאמת את פעולתו. כל הכבוד למחבר! אמנם ניתן להשתמש בו בחינם, אך זכור כי פרסום חוזר של הקוד כפוף ל־כללי הבית שלנו.

כתב ויתור
המידע והפרסומים אינם מיועדים להיות, ואינם מהווים, ייעוץ או המלצה פיננסית, השקעתית, מסחרית או מכל סוג אחר המסופקת או מאושרת על ידי TradingView. קרא עוד ב־תנאי השימוש.
סקריפט קוד פתוח
ברוח האמיתית של TradingView, יוצר הסקריפט הזה הפך אותו לקוד פתוח, כך שסוחרים יוכלו לעיין בו ולאמת את פעולתו. כל הכבוד למחבר! אמנם ניתן להשתמש בו בחינם, אך זכור כי פרסום חוזר של הקוד כפוף ל־כללי הבית שלנו.
כתב ויתור
המידע והפרסומים אינם מיועדים להיות, ואינם מהווים, ייעוץ או המלצה פיננסית, השקעתית, מסחרית או מכל סוג אחר המסופקת או מאושרת על ידי TradingView. קרא עוד ב־תנאי השימוש.