Structure-Colored EMA [Leonichev]
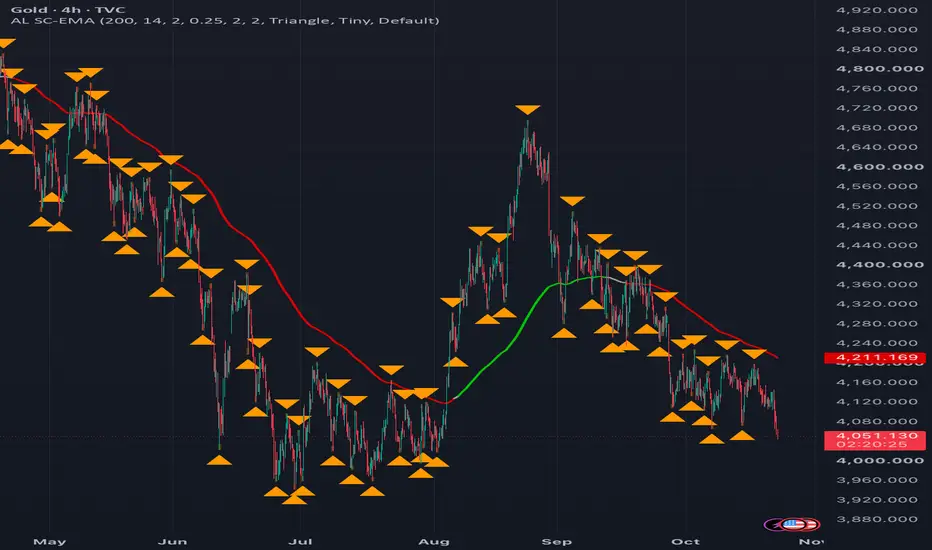
Structure-Colored EMA colors a long EMA (200 by default) by market structure rather than by its slope or by price crossing it. The color changes only when a new swing is confirmed, so the line ignores single candles that poke through the EMA and reacts to where the swings themselves form.
How it works
1. Swings. An ATR-based zigzag finds swing highs and lows. A swing high is the highest high since the last swing low, and it is confirmed once price has moved a set number of ATRs (2.0 by default) below it. Swings alternate high/low, and a confirmed swing is never moved or deleted.
2. Swing zones. Each swing gets a zone of fixed height (0.25 ATR by default) running from the wick toward the most extreme candle body around the swing. Zones are used instead of single prices so that a swing that just touches the EMA counts as touching it.
3. EMA color. Every time a swing is confirmed, the last swing high and swing low are compared with the EMA value at the bar of the newest swing:
- Green: both swing zones are above the EMA.
- Red: both swing zones are below the EMA.
- Gray: both zones touch the EMA (price is ranging around it).
- Transition (high above the EMA, low below it): the indicator takes the midpoint between the two zones. If the EMA is still on the side of the previous trend relative to that midpoint, the previous color is kept, because one swing only pierced the EMA. Otherwise the line turns gray.
How to use it
- Use the color as a trend filter: look for longs while the line is green, shorts while it is red, and stay cautious while it is gray.
- Turn on the HH / HL / LH / LL text to read the structure that drives the color.
- Raise the "Swing reversal" multiplier for a slower, higher-timeframe view of the structure; lower it for a faster one.
- Alerts are available for trend changes (up, down, neutral) and for every confirmed swing. The trend state is also exposed in the Data Window as 1 / -1 / 0.
Repainting and timing
All calculations run on closed bars only; nothing uses future data. A swing can only be confirmed after price has moved away from it, so the swing marker is drawn back on the bar of the extreme a few bars after that extreme formed. The EMA color changes on the confirmation bar, not on the bar of the swing. Once drawn, markers, zones and colors do not change.
Settings
- EMA length, ATR length, swing reversal (× ATR).
- Zone height (× ATR) and the number of bars searched on each side of the swing for the candle body.
- Visibility and style options for the EMA, markers, text and zones.
This is a charting tool, not a trading system, and it does not predict price. Test it on your own markets and timeframes before relying on it.
How it works
1. Swings. An ATR-based zigzag finds swing highs and lows. A swing high is the highest high since the last swing low, and it is confirmed once price has moved a set number of ATRs (2.0 by default) below it. Swings alternate high/low, and a confirmed swing is never moved or deleted.
2. Swing zones. Each swing gets a zone of fixed height (0.25 ATR by default) running from the wick toward the most extreme candle body around the swing. Zones are used instead of single prices so that a swing that just touches the EMA counts as touching it.
3. EMA color. Every time a swing is confirmed, the last swing high and swing low are compared with the EMA value at the bar of the newest swing:
- Green: both swing zones are above the EMA.
- Red: both swing zones are below the EMA.
- Gray: both zones touch the EMA (price is ranging around it).
- Transition (high above the EMA, low below it): the indicator takes the midpoint between the two zones. If the EMA is still on the side of the previous trend relative to that midpoint, the previous color is kept, because one swing only pierced the EMA. Otherwise the line turns gray.
How to use it
- Use the color as a trend filter: look for longs while the line is green, shorts while it is red, and stay cautious while it is gray.
- Turn on the HH / HL / LH / LL text to read the structure that drives the color.
- Raise the "Swing reversal" multiplier for a slower, higher-timeframe view of the structure; lower it for a faster one.
- Alerts are available for trend changes (up, down, neutral) and for every confirmed swing. The trend state is also exposed in the Data Window as 1 / -1 / 0.
Repainting and timing
All calculations run on closed bars only; nothing uses future data. A swing can only be confirmed after price has moved away from it, so the swing marker is drawn back on the bar of the extreme a few bars after that extreme formed. The EMA color changes on the confirmation bar, not on the bar of the swing. Once drawn, markers, zones and colors do not change.
Settings
- EMA length, ATR length, swing reversal (× ATR).
- Zone height (× ATR) and the number of bars searched on each side of the swing for the candle body.
- Visibility and style options for the EMA, markers, text and zones.
This is a charting tool, not a trading system, and it does not predict price. Test it on your own markets and timeframes before relying on it.

כתב ויתור
המידע והפרסומים אינם מיועדים להיות, ואינם מהווים, ייעוץ או המלצה פיננסית, השקעתית, מסחרית או מכל סוג אחר המסופקת או מאושרת על ידי TradingView. קרא עוד ב־תנאי השימוש.
כתב ויתור
המידע והפרסומים אינם מיועדים להיות, ואינם מהווים, ייעוץ או המלצה פיננסית, השקעתית, מסחרית או מכל סוג אחר המסופקת או מאושרת על ידי TradingView. קרא עוד ב־תנאי השימוש.