מעודכן
Svopex Supply & Demand Zones
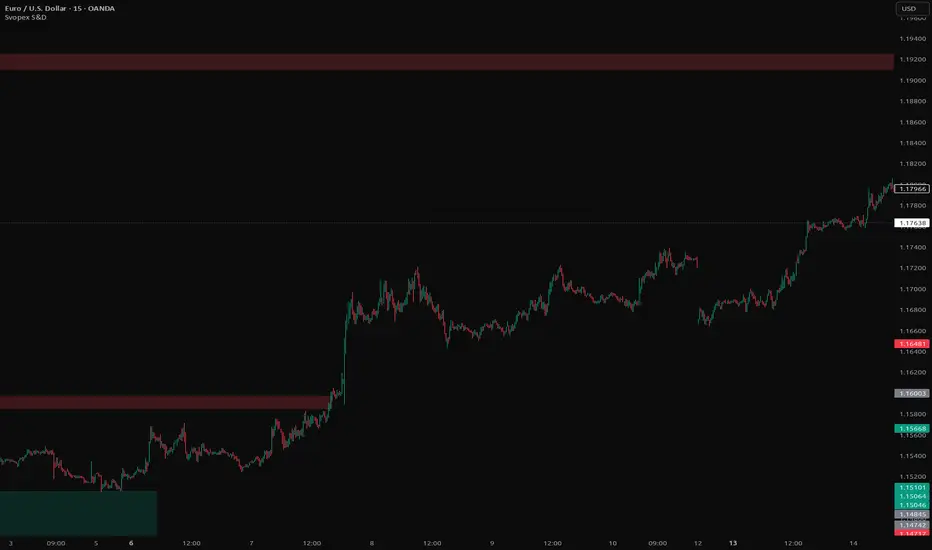
Automatically detects and plots Supply and Demand zones using 4H price action — works on any chart timeframe.
This indicator draws the classic Supply & Demand zones that institutional traders watch: areas
where price consolidated (a "base") and then exploded away sharply. These zones often act as
powerful support/resistance when price returns.
- Supply zones (red) — where price consolidated, then dropped sharply → expect selling
pressure on retest.
- Demand zones (green) — where price consolidated, then rallied sharply → expect buying
pressure on retest.
- Zones extend to the right and automatically freeze the moment price closes through them, so
your chart stays clean.
- Detection always runs on the 4H timeframe (configurable), regardless of the chart you're
viewing — so zones stay consistent whether you're on 15m, 1H, 4H or Daily.
How it works
A zone is formed by the textbook 4-candle patterns:
- DBR (Drop → Base → Rally) → Demand zone
- RBR (Rally → Base → Rally) → Demand zone
- RBD (Rally → Base → Drop) → Supply zone
- DBD (Drop → Base → Drop) → Supply zone
Detection logic:
1. Base candle = body smaller than Base body ≤ ATR × (default 0.5 × ATR).
2. Explosive candle = body larger than Explosive body ≥ ATR × (default 1.5 × ATR).
3. When 1–3 base candles are followed by an explosive candle, the base range becomes a zone.
4. The zone is drawn from the base's start time, with top = highest base high and bottom =
lowest base low.
5. Zones are non-repainting — detection uses the previous confirmed HTF bar (request.security
with lookahead_off + [1]).
Inputs
• Zone Timeframe — default 240 (4H). Timeframe used for zone detection.
• Max base candles — default 3. Maximum base candles allowed before the explosive move.
• Base body ≤ ATR × — default 0.5. Base candle body must be smaller than this × ATR.
• Explosive body ≥ ATR × — default 1.5. Breakout candle body must be larger than this × ATR.
• ATR length — default 14. Reference volatility for base/explosive classification.
• Supply / Demand fill — default red / green @ 80% transparency. Zone colors, fully
customizable.
• Show labels — default ON. Displays "Supply" / "Demand" text labels.
• Max active zones per side — default 20. FIFO cap to keep the chart tidy.
How to use it
- Swing / day trading: Watch for price to retest a zone and look for rejection candles /
reversal signals.
- Confluence: Zones overlapping with POC, VAH/VAL, LVN, prior session high/low or
psychological levels are significantly stronger.
- Trend continuation: In an uptrend, buy retests of Demand zones; in a downtrend, sell retests
of Supply zones.
- Broken zones: Once price closes through a zone, the box is frozen — a broken Supply often
flips into Demand (and vice versa).
Tuning guide
- Too many zones? Increase Explosive body ≥ ATR × to 2.0 and/or lower Base body ≤ ATR × to
0.3.
- Not enough zones / high-volatility asset? Raise Max base candles to 5–6 and lower Explosive
body ≥ ATR × to 1.2.
- Forex / indices / futures → defaults work well.
- Crypto → try Explosive body ≥ ATR × = 2.0 for cleaner signals.
Notes
- Detection is based on candle bodies, not wicks — long-wick base candles may occasionally
produce wider zones than expected.
- Zone break is measured on close, not wick — intrabar spikes through a zone will NOT
invalidate it (by design — filters noise).
- Zones appear only after the next 4H candle confirms → non-repainting, but with one HTF-bar
delay.
Open-source. Feel free to fork, tweak, and make it your own. Feedback welcome in the comments.
This indicator draws the classic Supply & Demand zones that institutional traders watch: areas
where price consolidated (a "base") and then exploded away sharply. These zones often act as
powerful support/resistance when price returns.
- Supply zones (red) — where price consolidated, then dropped sharply → expect selling
pressure on retest.
- Demand zones (green) — where price consolidated, then rallied sharply → expect buying
pressure on retest.
- Zones extend to the right and automatically freeze the moment price closes through them, so
your chart stays clean.
- Detection always runs on the 4H timeframe (configurable), regardless of the chart you're
viewing — so zones stay consistent whether you're on 15m, 1H, 4H or Daily.
How it works
A zone is formed by the textbook 4-candle patterns:
- DBR (Drop → Base → Rally) → Demand zone
- RBR (Rally → Base → Rally) → Demand zone
- RBD (Rally → Base → Drop) → Supply zone
- DBD (Drop → Base → Drop) → Supply zone
Detection logic:
1. Base candle = body smaller than Base body ≤ ATR × (default 0.5 × ATR).
2. Explosive candle = body larger than Explosive body ≥ ATR × (default 1.5 × ATR).
3. When 1–3 base candles are followed by an explosive candle, the base range becomes a zone.
4. The zone is drawn from the base's start time, with top = highest base high and bottom =
lowest base low.
5. Zones are non-repainting — detection uses the previous confirmed HTF bar (request.security
with lookahead_off + [1]).
Inputs
• Zone Timeframe — default 240 (4H). Timeframe used for zone detection.
• Max base candles — default 3. Maximum base candles allowed before the explosive move.
• Base body ≤ ATR × — default 0.5. Base candle body must be smaller than this × ATR.
• Explosive body ≥ ATR × — default 1.5. Breakout candle body must be larger than this × ATR.
• ATR length — default 14. Reference volatility for base/explosive classification.
• Supply / Demand fill — default red / green @ 80% transparency. Zone colors, fully
customizable.
• Show labels — default ON. Displays "Supply" / "Demand" text labels.
• Max active zones per side — default 20. FIFO cap to keep the chart tidy.
How to use it
- Swing / day trading: Watch for price to retest a zone and look for rejection candles /
reversal signals.
- Confluence: Zones overlapping with POC, VAH/VAL, LVN, prior session high/low or
psychological levels are significantly stronger.
- Trend continuation: In an uptrend, buy retests of Demand zones; in a downtrend, sell retests
of Supply zones.
- Broken zones: Once price closes through a zone, the box is frozen — a broken Supply often
flips into Demand (and vice versa).
Tuning guide
- Too many zones? Increase Explosive body ≥ ATR × to 2.0 and/or lower Base body ≤ ATR × to
0.3.
- Not enough zones / high-volatility asset? Raise Max base candles to 5–6 and lower Explosive
body ≥ ATR × to 1.2.
- Forex / indices / futures → defaults work well.
- Crypto → try Explosive body ≥ ATR × = 2.0 for cleaner signals.
Notes
- Detection is based on candle bodies, not wicks — long-wick base candles may occasionally
produce wider zones than expected.
- Zone break is measured on close, not wick — intrabar spikes through a zone will NOT
invalidate it (by design — filters noise).
- Zones appear only after the next 4H candle confirms → non-repainting, but with one HTF-bar
delay.
Open-source. Feel free to fork, tweak, and make it your own. Feedback welcome in the comments.
הערות שחרור
Auto-detects Supply & Demand zones from higher-timeframe price action — works on any chart TF with full control over when a zone is "broken". What it does
🟥 Supply (red) — price consolidated, then dropped sharply → sellers likely on retest.
🟩 Demand (green) — price consolidated, then rallied sharply → buyers likely on retest.
Zones extend right and auto-freeze when price penetrates them by a user-defined amount. Detection runs on 4H by default (configurable), so zones stay
consistent on any chart timeframe.
How it works
Detects the four S&D patterns: DBR / RBR → Demand · RBD / DBD → Supply.
A base candle = body < Base body ≤ ATR × (0.5× ATR). An **explosive candle** = body > Explosive body ≥ ATR × (1.5× ATR). When 1–3 base candles are followed by
an explosive candle, the base range becomes a zone. Non-repainting — uses the previous confirmed HTF bar.
Zone Break
Include wicks (default OFF) — ON = wicks count as penetration, OFF = body only.
Break threshold (%) (default 100) — zone ends when penetration reaches this %:
100 = full break (classic) · 70–80 = conservative · 50 = midpoint · 0 = any touch.
Inputs
Zone Timeframe (240) · Max base candles (3) · Base body ≤ ATR × (0.5) · Explosive body ≥ ATR × (1.5) · ATR length (14) · Include wicks (OFF) · Break threshold
% (100) · Supply / Demand fill (red / green @ 80%) · Show labels (ON) · Max active zones per side (20).
How to use it
Buy Demand retests in uptrends, sell Supply retests in downtrends, look for rejection. Confluence with POC, VAH/VAL, LVN or session levels makes zones
stronger. Broken Supply often flips to Demand (and vice versa).
Tuning
Too many zones → Explosive × 2.0, Base body × 0.3.
Too few / volatile → Max base candles 5–6, Explosive × 1.2.
Crypto → Explosive × 2.0.
Notes
Detection is body-based (long wicks can widen zones). Break is evaluated on bar close — no intrabar flicker. Zones appear after the next HTF candle confirms
(non-repainting, one HTF-bar delay).
---
Open-source — fork it, tweak it, feedback welcome.
הערות שחרור
New name. New picture.הערות שחרור
v2.1 — Added "Show zone border" toggle Under Visuals → new boolean input. When OFF (default), zones render as clean fill only (no border).
When ON, each zone gets a thin colored border (1px) matching its side.
No changes to detection logic or break behavior.
הערות שחרור
Rename script...הערות שחרור
V3 - added "Use chart timeframe" toggle (default OFF). When ON, zone detection follows the chart's current timeframe (e.g. switching chart to 15M displays 15M zones); when OFF, uses the fixed Zone Timeframe setting.
הערות שחרור
● What's new in this version - Use chart timeframe — now enabled by default. Zone detection follows the chart's timeframe out of the box; switch to a fixed HTF only if needed.
- Include wicks — now enabled by default. Zone breaks are evaluated against full candle highs/lows instead of bodies, catching wick-only invalidations.
- Break threshold — default lowered from 100% to 0%. Any touch of the zone now closes it (strict invalidation); raise the value if you prefer partial-penetration
tolerance.
- Show labels — now disabled by default for a cleaner chart. Re-enable in settings if you want the "Supply" / "Demand" tags.
No logic changes — only default values were updated to match the most common usage. Existing chart instances keep their saved settings; click "Defaults → Reset
Settings" or re-add the indicator to pick up the new defaults.

כתב ויתור
המידע והפרסומים אינם מיועדים להיות, ואינם מהווים, ייעוץ או המלצה פיננסית, השקעתית, מסחרית או מכל סוג אחר המסופקת או מאושרת על ידי TradingView. קרא עוד ב־תנאי השימוש.
כתב ויתור
המידע והפרסומים אינם מיועדים להיות, ואינם מהווים, ייעוץ או המלצה פיננסית, השקעתית, מסחרית או מכל סוג אחר המסופקת או מאושרת על ידי TradingView. קרא עוד ב־תנאי השימוש.