OPEN-SOURCE SCRIPT
Monthly DCA & Last 10 Years
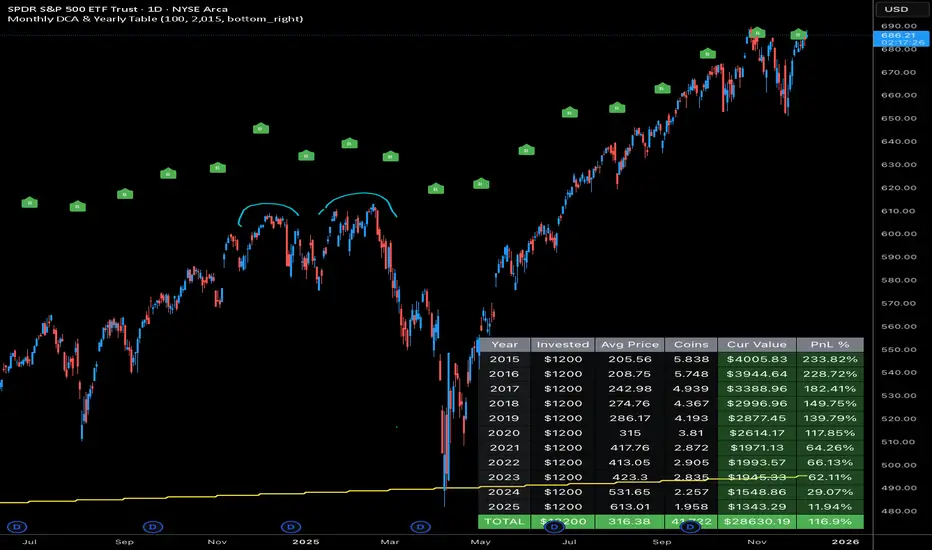
This Pine Script indicator simulates a Monthly Dollar Cost Averaging (DCA) strategy to help long-term investors visualize historical performance. Instead of complex timing, the script automatically executes a hypothetical fixed-dollar purchase (e.g., $100) on the first trading day of every month. It visually marks entry points with green "B" labels and plots a dynamic yellow line representing your Global Break-Even Price, allowing you to instantly see if the current price is above or below your average cost basis. To provide deep insight, it generates a detailed performance table in the bottom-right corner that breaks down metrics year-by-year—including total capital invested, shares/coins accumulated, and Profit/Loss percentage—along with a grand total summary of the entire investment period.
סקריפט קוד פתוח
ברוח האמיתית של TradingView, יוצר הסקריפט הזה הפך אותו לקוד פתוח, כך שסוחרים יוכלו לעיין בו ולאמת את פעולתו. כל הכבוד למחבר! אמנם ניתן להשתמש בו בחינם, אך זכור כי פרסום חוזר של הקוד כפוף ל־כללי הבית שלנו.

כתב ויתור
המידע והפרסומים אינם מיועדים להיות, ואינם מהווים, ייעוץ או המלצה פיננסית, השקעתית, מסחרית או מכל סוג אחר המסופקת או מאושרת על ידי TradingView. קרא עוד ב־תנאי השימוש.
סקריפט קוד פתוח
ברוח האמיתית של TradingView, יוצר הסקריפט הזה הפך אותו לקוד פתוח, כך שסוחרים יוכלו לעיין בו ולאמת את פעולתו. כל הכבוד למחבר! אמנם ניתן להשתמש בו בחינם, אך זכור כי פרסום חוזר של הקוד כפוף ל־כללי הבית שלנו.
כתב ויתור
המידע והפרסומים אינם מיועדים להיות, ואינם מהווים, ייעוץ או המלצה פיננסית, השקעתית, מסחרית או מכל סוג אחר המסופקת או מאושרת על ידי TradingView. קרא עוד ב־תנאי השימוש.