STDV Extension Zones from Daily Open - OnlyFlow
STDV Extension Zones from Daily Open
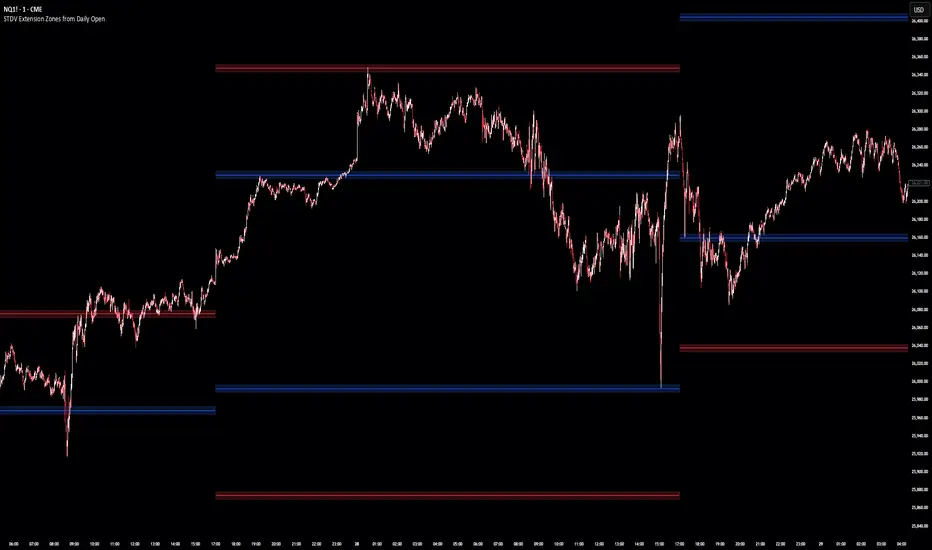
This indicator plots standard deviation extension zones based on the current day’s opening price. At the start of each trading day, it calculates the daily standard deviation using a configurable lookback and projects price zones at ±0.5 and ±1.0 standard deviations above and below the daily open.
Each zone is displayed as a horizontal band with a center line and a customizable thickness, extending forward throughout the session. Zones automatically reset and lock in place when a new day begins, preserving prior sessions for historical context.
The indicator is designed to visually highlight statistically significant price extensions relative to the daily open, helping users quickly identify areas where price may be stretched, balanced, or reacting around volatility-based levels.
This indicator plots standard deviation extension zones based on the current day’s opening price. At the start of each trading day, it calculates the daily standard deviation using a configurable lookback and projects price zones at ±0.5 and ±1.0 standard deviations above and below the daily open.
Each zone is displayed as a horizontal band with a center line and a customizable thickness, extending forward throughout the session. Zones automatically reset and lock in place when a new day begins, preserving prior sessions for historical context.
The indicator is designed to visually highlight statistically significant price extensions relative to the daily open, helping users quickly identify areas where price may be stretched, balanced, or reacting around volatility-based levels.

כתב ויתור
המידע והפרסומים אינם מיועדים להיות, ואינם מהווים, ייעוץ או המלצה פיננסית, השקעתית, מסחרית או מכל סוג אחר המסופקת או מאושרת על ידי TradingView. קרא עוד ב־תנאי השימוש.
כתב ויתור
המידע והפרסומים אינם מיועדים להיות, ואינם מהווים, ייעוץ או המלצה פיננסית, השקעתית, מסחרית או מכל סוג אחר המסופקת או מאושרת על ידי TradingView. קרא עוד ב־תנאי השימוש.