PROTECTED SOURCE SCRIPT
Nojai BTC Dynamic Channel & Zone Indicator
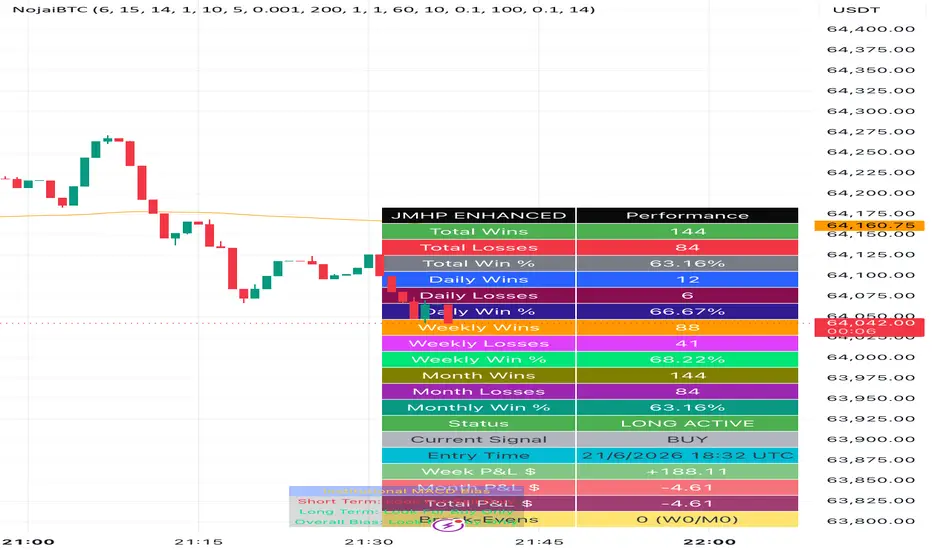
Overview
NojaiBTC is a powerful overlay indicator designed to identify dynamic support and resistance zones in real time. By tracking structural price channels, it marks key breakout and breakdown levels directly on your chart, giving traders a clear visual framework for bias, entries, and risk management.
Originally developed for Bitcoin and crypto markets, the logic translates cleanly to any liquid instrument — Forex pairs, indices, commodities, and equities alike.
How It Works
The indicator continuously evaluates price structure to build adaptive step-channels:
HIGHER zones (green) — form when price makes a higher structural move, signaling bullish momentum and potential continuation.
LOWER zones (red) — form when price breaks below a structural level, signaling bearish pressure and potential continuation to the downside.
Loss labels — mark the point where a channel boundary was breached, helping traders identify where previous bias was invalidated.
The channels update bar-by-bar and step with price, making them dynamic rather than static — unlike traditional fixed support/resistance lines.
Key Features
✅ Overlay on any chart — works across all timeframes
✅ Dynamic step-channels that adapt to price structure in real time
✅ Clear HIGHER / LOWER labels at key structural shifts
✅ Loss markers at channel invalidation points
✅ Clean, minimal visual design — no clutter
✅ Compatible with all asset classes (Crypto, Forex, Indices, Commodities)
How to Use
Bias — if price is trading inside or above a green (HIGHER) channel, bias is bullish. Inside or below a red (LOWER) channel = bearish bias.
Entries — look for price to retest the channel boundary after a breakout for a continuation trade.
Invalidation — a Loss label signals the channel has been broken. Reassess your bias when this appears.
Multi-timeframe — use on higher timeframes (H1, H4, D) to define structure, then drop to lower timeframes for precision entries.
Recommended Settings
Best timeframes: 1m, 5m, 15m for scalping | 1H, 4H for swing trading
Works on: BTCUSDT, XAUUSD, EURUSD, major Forex pairs, and crypto markets
Notes
This is a non-repainting structural indicator — zones are drawn based on confirmed price action.
Combine with volume analysis or momentum oscillators (e.g., RSI) for higher-probability setups.
Past performance of any strategy using this indicator does not guarantee future results. Always use proper risk management.
Created by nojai | NojaiBTC — Smart Structure, Smarter Trading.
NojaiBTC is a powerful overlay indicator designed to identify dynamic support and resistance zones in real time. By tracking structural price channels, it marks key breakout and breakdown levels directly on your chart, giving traders a clear visual framework for bias, entries, and risk management.
Originally developed for Bitcoin and crypto markets, the logic translates cleanly to any liquid instrument — Forex pairs, indices, commodities, and equities alike.
How It Works
The indicator continuously evaluates price structure to build adaptive step-channels:
HIGHER zones (green) — form when price makes a higher structural move, signaling bullish momentum and potential continuation.
LOWER zones (red) — form when price breaks below a structural level, signaling bearish pressure and potential continuation to the downside.
Loss labels — mark the point where a channel boundary was breached, helping traders identify where previous bias was invalidated.
The channels update bar-by-bar and step with price, making them dynamic rather than static — unlike traditional fixed support/resistance lines.
Key Features
✅ Overlay on any chart — works across all timeframes
✅ Dynamic step-channels that adapt to price structure in real time
✅ Clear HIGHER / LOWER labels at key structural shifts
✅ Loss markers at channel invalidation points
✅ Clean, minimal visual design — no clutter
✅ Compatible with all asset classes (Crypto, Forex, Indices, Commodities)
How to Use
Bias — if price is trading inside or above a green (HIGHER) channel, bias is bullish. Inside or below a red (LOWER) channel = bearish bias.
Entries — look for price to retest the channel boundary after a breakout for a continuation trade.
Invalidation — a Loss label signals the channel has been broken. Reassess your bias when this appears.
Multi-timeframe — use on higher timeframes (H1, H4, D) to define structure, then drop to lower timeframes for precision entries.
Recommended Settings
Best timeframes: 1m, 5m, 15m for scalping | 1H, 4H for swing trading
Works on: BTCUSDT, XAUUSD, EURUSD, major Forex pairs, and crypto markets
Notes
This is a non-repainting structural indicator — zones are drawn based on confirmed price action.
Combine with volume analysis or momentum oscillators (e.g., RSI) for higher-probability setups.
Past performance of any strategy using this indicator does not guarantee future results. Always use proper risk management.
Created by nojai | NojaiBTC — Smart Structure, Smarter Trading.
סקריפט מוגן
סקריפט זה פורסם כמקור סגור. עם זאת, תוכל להשתמש בו בחופשיות וללא כל מגבלות – למד עוד כאן

כתב ויתור
המידע והפרסומים אינם מיועדים להיות, ואינם מהווים, ייעוץ או המלצה פיננסית, השקעתית, מסחרית או מכל סוג אחר המסופקת או מאושרת על ידי TradingView. קרא עוד ב־תנאי השימוש.
סקריפט מוגן
סקריפט זה פורסם כמקור סגור. עם זאת, תוכל להשתמש בו בחופשיות וללא כל מגבלות – למד עוד כאן
כתב ויתור
המידע והפרסומים אינם מיועדים להיות, ואינם מהווים, ייעוץ או המלצה פיננסית, השקעתית, מסחרית או מכל סוג אחר המסופקת או מאושרת על ידי TradingView. קרא עוד ב־תנאי השימוש.