OPEN-SOURCE SCRIPT
RSI - Div - TDI (Conf + MTF)
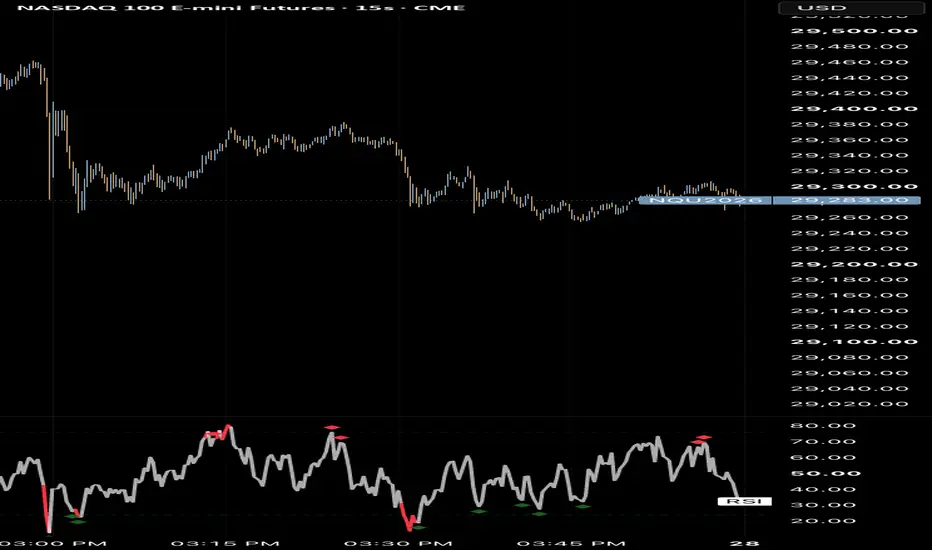
# RSI/TDI Multi-Timeframe Confirmed Divergences
**What it is**
A momentum tool that detects RSI divergences and — this is the point of the script — only reports them once they are confirmed on bar close, then checks whether the same divergence is occurring on several timeframes at once. It is built on the well-known RSI + TDI framework, but its purpose is not to re-display RSI or the TDI; it is to solve two specific problems with ordinary divergence scripts: they repaint while a bar is forming, and they treat a noisy 1-minute divergence the same as a broad 4-hour one. This script addresses both.
---
**What is original here (and why it is not just a mashup)**
Most open-source divergence indicators evaluate the divergence on the live, still-forming bar. That means a divergence can appear, then disappear before the candle closes — it repaints, and you cannot trust what you see in real time. This script gates every divergence to confirmed bars (it only commits a signal when the candle has closed), so a printed signal is final and will not vanish.
On top of that, it adds a multi-timeframe agreement engine that does not exist in the built-in or common divergence scripts:
- It runs the identical divergence calculation on up to five user-selected timeframes.
- It latches each timeframe's result only when that timeframe's own bar closes, so the cross-timeframe reading does not flicker as higher bars form.
- It uses a recency window so a higher-timeframe divergence stays "active" long enough to line up with the chart timeframe (since divergences on different timeframes rarely print on the same candle).
- It counts how many timeframes agree and recolors the signal when the count crosses a threshold you set.
That combination — non-repainting confirmation plus per-timeframe close-latched divergence agreement with a colored confluence output — is the original behavior, and the reason the components are bundled into one script rather than used separately.
---
**How the pieces work together**
Each component has a job; none is decorative:
- **RSI** is the momentum gauge — it measures whether recent buying or selling has more force.
- **The TDI Bollinger Bands on RSI** give that momentum a volatility/mean context, so you can see when RSI is stretched relative to its own recent range, not just relative to fixed levels.
- **The divergence detector** is the actual signal: it compares price extremes against RSI extremes and flags when they disagree.
- **The confirmation gate** removes the repainting so the signal is trustworthy.
- **The multi-timeframe layer** is the filter that separates a throwaway low-timeframe divergence from a broad, meaningful one — the higher the agreement, the more independent momentum readings are calling the same exhaustion at once.
Used together they answer one question: *is momentum genuinely exhausting here, across enough of the market to matter?*
---
**The concept behind the calculation**
A divergence is price and momentum disagreeing. A trend continues while each push carries more force than the last; when price makes a new extreme but RSI does not, the force behind the move is fading.
Over a lookback window the script tracks the running highest and lowest price and the RSI reading at those points, then:
- **Bullish divergence:** price makes a lower low, but RSI does not make a matching new low and begins turning up — selling pressure is drying up.
- **Bearish divergence:** price makes a higher high, but RSI fails to confirm with a higher high and rolls over — buying pressure is drying up.
The signal is therefore a read on **momentum exhaustion**, not a guaranteed turn. The higher-timeframe layer matters because a higher-timeframe RSI aggregates far more order flow into one reading, so a divergence there reflects a broad shift in control rather than local noise.
---
**How to use it**
- Add it to a separate pane and run it on the timeframe you trade.
- A dot marks a confirmed divergence (green = bullish, red = bearish). The dot only appears once the bar has closed.
- A purple dot means the divergence is present on multiple timeframes at once — the higher-conviction case.
- Treat it as exhaustion/reversal context. It is most useful combined with a price level (a prior high/low, support/resistance) and your own entry confirmation, rather than as a standalone buy/sell. Optional alerts are included for single-timeframe and multi-timeframe divergences.
---
**Settings**
- **RSI Length / Lookback** — the momentum period and the window the divergence is measured against.
- **Confirmed divergences only** — keep on for non-repainting signals; turn off to see live (flickering) divergences earlier.
- **Compare timeframes (up to 5)** — the timeframes checked for agreement, each with an on/off toggle.
- **Timeframes needed for purple** — how many must agree before the dot recolors.
- **Other-TF recency** — how long another timeframe's divergence stays active so it can align with the chart.
- **Colors** — every plot (RSI line, bands, divergence dots, agreement color, pivots) is user-configurable.
- TDI Bollinger Band length/type, second RSI, and overbought/oversold levels are included for context and configurable.
---
**Notes and limitations**
- Signals are non-repainting on the chart timeframe because they confirm on close. Higher-timeframe components naturally finalize only when their own bar closes, which is expected multi-timeframe behavior — read the multi-timeframe agreement on closed bars.
- Divergence indicates momentum exhaustion, which does not guarantee an immediate reversal; trends can remain divergent for some time. Use confirmation.
- This script is for analysis and education and is not financial advice.
---
**Credits**
Built on the open-source RSI and Traders Dynamic Index (TDI) divergence approach. Original RSI/TDI divergence logic credit to QuantTherapyThe confirmed-on-close handling and the multi-timeframe divergence-agreement engine are additions in this version.
**What it is**
A momentum tool that detects RSI divergences and — this is the point of the script — only reports them once they are confirmed on bar close, then checks whether the same divergence is occurring on several timeframes at once. It is built on the well-known RSI + TDI framework, but its purpose is not to re-display RSI or the TDI; it is to solve two specific problems with ordinary divergence scripts: they repaint while a bar is forming, and they treat a noisy 1-minute divergence the same as a broad 4-hour one. This script addresses both.
---
**What is original here (and why it is not just a mashup)**
Most open-source divergence indicators evaluate the divergence on the live, still-forming bar. That means a divergence can appear, then disappear before the candle closes — it repaints, and you cannot trust what you see in real time. This script gates every divergence to confirmed bars (it only commits a signal when the candle has closed), so a printed signal is final and will not vanish.
On top of that, it adds a multi-timeframe agreement engine that does not exist in the built-in or common divergence scripts:
- It runs the identical divergence calculation on up to five user-selected timeframes.
- It latches each timeframe's result only when that timeframe's own bar closes, so the cross-timeframe reading does not flicker as higher bars form.
- It uses a recency window so a higher-timeframe divergence stays "active" long enough to line up with the chart timeframe (since divergences on different timeframes rarely print on the same candle).
- It counts how many timeframes agree and recolors the signal when the count crosses a threshold you set.
That combination — non-repainting confirmation plus per-timeframe close-latched divergence agreement with a colored confluence output — is the original behavior, and the reason the components are bundled into one script rather than used separately.
---
**How the pieces work together**
Each component has a job; none is decorative:
- **RSI** is the momentum gauge — it measures whether recent buying or selling has more force.
- **The TDI Bollinger Bands on RSI** give that momentum a volatility/mean context, so you can see when RSI is stretched relative to its own recent range, not just relative to fixed levels.
- **The divergence detector** is the actual signal: it compares price extremes against RSI extremes and flags when they disagree.
- **The confirmation gate** removes the repainting so the signal is trustworthy.
- **The multi-timeframe layer** is the filter that separates a throwaway low-timeframe divergence from a broad, meaningful one — the higher the agreement, the more independent momentum readings are calling the same exhaustion at once.
Used together they answer one question: *is momentum genuinely exhausting here, across enough of the market to matter?*
---
**The concept behind the calculation**
A divergence is price and momentum disagreeing. A trend continues while each push carries more force than the last; when price makes a new extreme but RSI does not, the force behind the move is fading.
Over a lookback window the script tracks the running highest and lowest price and the RSI reading at those points, then:
- **Bullish divergence:** price makes a lower low, but RSI does not make a matching new low and begins turning up — selling pressure is drying up.
- **Bearish divergence:** price makes a higher high, but RSI fails to confirm with a higher high and rolls over — buying pressure is drying up.
The signal is therefore a read on **momentum exhaustion**, not a guaranteed turn. The higher-timeframe layer matters because a higher-timeframe RSI aggregates far more order flow into one reading, so a divergence there reflects a broad shift in control rather than local noise.
---
**How to use it**
- Add it to a separate pane and run it on the timeframe you trade.
- A dot marks a confirmed divergence (green = bullish, red = bearish). The dot only appears once the bar has closed.
- A purple dot means the divergence is present on multiple timeframes at once — the higher-conviction case.
- Treat it as exhaustion/reversal context. It is most useful combined with a price level (a prior high/low, support/resistance) and your own entry confirmation, rather than as a standalone buy/sell. Optional alerts are included for single-timeframe and multi-timeframe divergences.
---
**Settings**
- **RSI Length / Lookback** — the momentum period and the window the divergence is measured against.
- **Confirmed divergences only** — keep on for non-repainting signals; turn off to see live (flickering) divergences earlier.
- **Compare timeframes (up to 5)** — the timeframes checked for agreement, each with an on/off toggle.
- **Timeframes needed for purple** — how many must agree before the dot recolors.
- **Other-TF recency** — how long another timeframe's divergence stays active so it can align with the chart.
- **Colors** — every plot (RSI line, bands, divergence dots, agreement color, pivots) is user-configurable.
- TDI Bollinger Band length/type, second RSI, and overbought/oversold levels are included for context and configurable.
---
**Notes and limitations**
- Signals are non-repainting on the chart timeframe because they confirm on close. Higher-timeframe components naturally finalize only when their own bar closes, which is expected multi-timeframe behavior — read the multi-timeframe agreement on closed bars.
- Divergence indicates momentum exhaustion, which does not guarantee an immediate reversal; trends can remain divergent for some time. Use confirmation.
- This script is for analysis and education and is not financial advice.
---
**Credits**
Built on the open-source RSI and Traders Dynamic Index (TDI) divergence approach. Original RSI/TDI divergence logic credit to QuantTherapyThe confirmed-on-close handling and the multi-timeframe divergence-agreement engine are additions in this version.
סקריפט קוד פתוח
ברוח האמיתית של TradingView, יוצר הסקריפט הזה הפך אותו לקוד פתוח, כך שסוחרים יוכלו לעיין בו ולאמת את פעולתו. כל הכבוד למחבר! אמנם ניתן להשתמש בו בחינם, אך זכור כי פרסום חוזר של הקוד כפוף ל־כללי הבית שלנו.

כתב ויתור
המידע והפרסומים אינם מיועדים להיות, ואינם מהווים, ייעוץ או המלצה פיננסית, השקעתית, מסחרית או מכל סוג אחר המסופקת או מאושרת על ידי TradingView. קרא עוד ב־תנאי השימוש.
סקריפט קוד פתוח
ברוח האמיתית של TradingView, יוצר הסקריפט הזה הפך אותו לקוד פתוח, כך שסוחרים יוכלו לעיין בו ולאמת את פעולתו. כל הכבוד למחבר! אמנם ניתן להשתמש בו בחינם, אך זכור כי פרסום חוזר של הקוד כפוף ל־כללי הבית שלנו.
כתב ויתור
המידע והפרסומים אינם מיועדים להיות, ואינם מהווים, ייעוץ או המלצה פיננסית, השקעתית, מסחרית או מכל סוג אחר המסופקת או מאושרת על ידי TradingView. קרא עוד ב־תנאי השימוש.