OPEN-SOURCE SCRIPT
Tristan HTF Master - Multi Timeframe Overlay
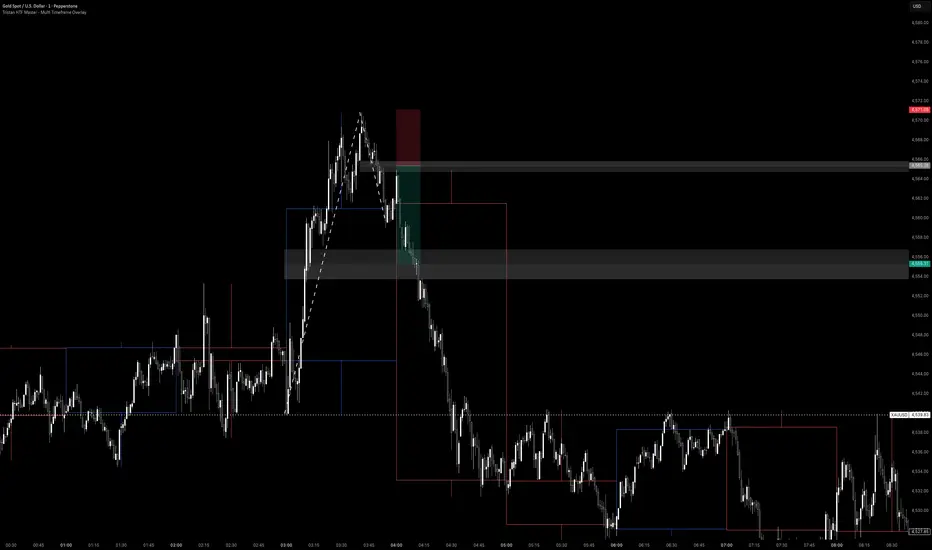
Welcome to my indicator, a powerful multi-timeframe (MTF) visualization tool designed specifically for traders who rely on "Candle Behavior Strategies" and precise timing strategies. I use this indicator as an orientation
If you base your trades on the internal mechanics of Higher Timeframe (HTF) candles—such as tracking the open, high, low, and close of a 1-hour candle while executing on the 1-minute or 5-minute chart—this indicator is built for you.
The Core Concept: Time-Based Candle Behavior: Depending on your strategy in my opinion it is best suited for Time Based Strategies.
This indicator was developed with a specific structural trading strategy in mind (heavily inspired by concepts of "Tom Trades" Candle Behavior Reversal. So respects to him. The core philosophy revolves around observing how a Higher Timeframe candle (e.g., the 1H candle) behaves during its lifespan.
Often, in ranging or consolidating markets, a 1H candle will exhibit a distinct pattern:
First 30 Minutes (The Trap): The market creates a sudden Liquidity Sweep accompanied by an Overextension. This often traps breakout traders.
The Reversal (At ~30 Mins): Right around the midpoint of the candle's lifespan, the market loses momentum, reverses, and creates a Type 3 Market Shift / Break of Structure (BoS) on the lower timeframes.
Last 30 Minutes (The Retrace): The price retraces back into the HTF candle's range, often pulling back up to 50% of the initial overextension before the candle closes.
Because precise timing is everything in this strategy, the Tristan HTF Master visually draws the HTF candle directly onto your lower timeframe chart from the very first second it opens. You can visually track exactly when the 30-minute mark is reached without having to constantly switch timeframes or check the clock.
How to Trade the Strategy Using This Indicator
While this tool can be used for any MTF strategy, here is the optimal step-by-step setup it was designed for:
Market Condition: Identify a ranging market. Avoid massive, aggressive trending environments. Look for longs in the lower third of the range, and shorts in the upper third.
The Setup: Wait for a Liquidity Sweep and an Overextension during the first half of the HTF candle (e.g., the first 30 mins of the 1H box).
The Trigger: Look for a Type 3 Market Shift (Break of Structure) on the lower timeframe, confirming the exhaustion of the overextension.
The Entry: Pull your Fibonacci tool over the Type 3 shift. Place a limit order at the 50% retracement level of that shift (ideally backed by a factual shift confirmation).
Stop Loss (SL): Placed strictly above the local high (for shorts) or below the local low (for longs) of the sweep.
Take Profit (TP): Target the 50% retracement level of the entire initial overextension.
Indicator Features
Dynamic HTF Boxes: Overlays 15m, 30m, 1H, or 4H candles perfectly onto your current LTF chart. The boxes span the full width of the time period from the moment they open.
100% Transparent Bodies: The HTF box bodies are fully transparent. This allows you to clearly read the internal Lower Timeframe (LTF) price action without visual clutter.
Real-Time Wicks: The wicks of the HTF candle update dynamically in the center of the box as new highs and lows are formed.
Live Countdown Timer: Includes a clean, built-in countdown label attached to the active HTF candle, showing exactly how much time is left until the candle closes.
Disclaimer: This script and the described strategy are for educational purposes only and do not constitute financial advice. Past performance is not indicative of future results. Always backtest strategies thoroughly and manage your risk appropriately.
If you base your trades on the internal mechanics of Higher Timeframe (HTF) candles—such as tracking the open, high, low, and close of a 1-hour candle while executing on the 1-minute or 5-minute chart—this indicator is built for you.
The Core Concept: Time-Based Candle Behavior: Depending on your strategy in my opinion it is best suited for Time Based Strategies.
This indicator was developed with a specific structural trading strategy in mind (heavily inspired by concepts of "Tom Trades" Candle Behavior Reversal. So respects to him. The core philosophy revolves around observing how a Higher Timeframe candle (e.g., the 1H candle) behaves during its lifespan.
Often, in ranging or consolidating markets, a 1H candle will exhibit a distinct pattern:
First 30 Minutes (The Trap): The market creates a sudden Liquidity Sweep accompanied by an Overextension. This often traps breakout traders.
The Reversal (At ~30 Mins): Right around the midpoint of the candle's lifespan, the market loses momentum, reverses, and creates a Type 3 Market Shift / Break of Structure (BoS) on the lower timeframes.
Last 30 Minutes (The Retrace): The price retraces back into the HTF candle's range, often pulling back up to 50% of the initial overextension before the candle closes.
Because precise timing is everything in this strategy, the Tristan HTF Master visually draws the HTF candle directly onto your lower timeframe chart from the very first second it opens. You can visually track exactly when the 30-minute mark is reached without having to constantly switch timeframes or check the clock.
How to Trade the Strategy Using This Indicator
While this tool can be used for any MTF strategy, here is the optimal step-by-step setup it was designed for:
Market Condition: Identify a ranging market. Avoid massive, aggressive trending environments. Look for longs in the lower third of the range, and shorts in the upper third.
The Setup: Wait for a Liquidity Sweep and an Overextension during the first half of the HTF candle (e.g., the first 30 mins of the 1H box).
The Trigger: Look for a Type 3 Market Shift (Break of Structure) on the lower timeframe, confirming the exhaustion of the overextension.
The Entry: Pull your Fibonacci tool over the Type 3 shift. Place a limit order at the 50% retracement level of that shift (ideally backed by a factual shift confirmation).
Stop Loss (SL): Placed strictly above the local high (for shorts) or below the local low (for longs) of the sweep.
Take Profit (TP): Target the 50% retracement level of the entire initial overextension.
Indicator Features
Dynamic HTF Boxes: Overlays 15m, 30m, 1H, or 4H candles perfectly onto your current LTF chart. The boxes span the full width of the time period from the moment they open.
100% Transparent Bodies: The HTF box bodies are fully transparent. This allows you to clearly read the internal Lower Timeframe (LTF) price action without visual clutter.
Real-Time Wicks: The wicks of the HTF candle update dynamically in the center of the box as new highs and lows are formed.
Live Countdown Timer: Includes a clean, built-in countdown label attached to the active HTF candle, showing exactly how much time is left until the candle closes.
Disclaimer: This script and the described strategy are for educational purposes only and do not constitute financial advice. Past performance is not indicative of future results. Always backtest strategies thoroughly and manage your risk appropriately.
סקריפט קוד פתוח
ברוח האמיתית של TradingView, יוצר הסקריפט הזה הפך אותו לקוד פתוח, כך שסוחרים יוכלו לעיין בו ולאמת את פעולתו. כל הכבוד למחבר! אמנם ניתן להשתמש בו בחינם, אך זכור כי פרסום חוזר של הקוד כפוף ל־כללי הבית שלנו.

כתב ויתור
המידע והפרסומים אינם מיועדים להיות, ואינם מהווים, ייעוץ או המלצה פיננסית, השקעתית, מסחרית או מכל סוג אחר המסופקת או מאושרת על ידי TradingView. קרא עוד ב־תנאי השימוש.
סקריפט קוד פתוח
ברוח האמיתית של TradingView, יוצר הסקריפט הזה הפך אותו לקוד פתוח, כך שסוחרים יוכלו לעיין בו ולאמת את פעולתו. כל הכבוד למחבר! אמנם ניתן להשתמש בו בחינם, אך זכור כי פרסום חוזר של הקוד כפוף ל־כללי הבית שלנו.
כתב ויתור
המידע והפרסומים אינם מיועדים להיות, ואינם מהווים, ייעוץ או המלצה פיננסית, השקעתית, מסחרית או מכל סוג אחר המסופקת או מאושרת על ידי TradingView. קרא עוד ב־תנאי השימוש.