מעודכן
Elite CVD: volume delta with directional wick attribution
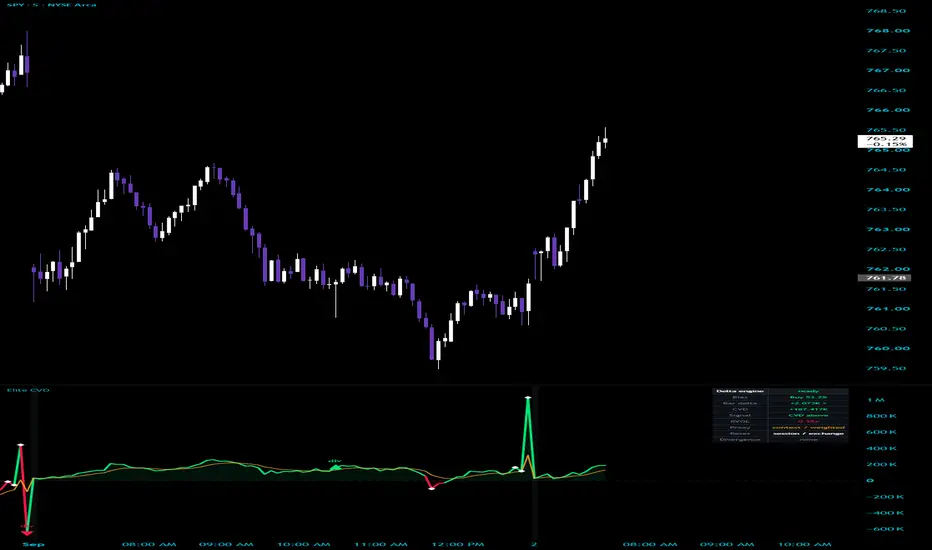
A cumulative volume delta that attributes wick volume directionally instead of splitting every bar down the middle, with all three proxy models exposed so you can compare them yourself.
What it does
Volume delta estimates how much of a bar's volume was buyer-initiated versus seller-initiated, then accumulates the difference into a running total. When that total rises while price stalls, buyers are absorbing supply. When it falls while price grinds higher, the advance is not being paid for. This plots that total, colours each bar's contribution by whether the pressure is building or fading, marks unusually heavy volume, and flags divergences between the total and price.
What is different here
Cumulative volume delta is a public idea with many open-source implementations on this platform, and I claim no ownership of it. What differs is how the volume gets attributed.
Almost every delta proxy splits a bar by where the close sits within the range. That treats both wicks as neutral, which is a choice, and usually an unexamined one. It says the volume in a long lower wick carries the same meaning as volume in a long upper wick.
This one reads wicks directionally. On an up bar, the lower wick is treated as selling that buyers absorbed and overcame, so most of that volume is credited to buyers, while the upper wick is treated as rejection and mostly credited to sellers. On a down bar the reading inverts. The split is 75/25 rather than 50/50, and the body always goes to the direction the bar closed.
Whether that assumption is better than the neutral one is something you should decide rather than take on faith, so the classic model, the directional model, and an average of the two are all selectable from one dropdown. Switch between them on your own instrument and see whether the difference matters. If it does not, use the classic one.
How the parts work together
Four components share one job, which is why they sit in one script rather than four.
The delta engine produces the per-bar reading. The relative-volume layer scales that reading by how heavy the bar was against its own recent average, using a square root so a four-times-volume bar counts double rather than quadruple. That matters because a large delta on thin volume is noise and a moderate delta on heavy volume is participation, and an unweighted total treats them as equal.
The acceleration colouring compares each bar's delta to its own reading a few bars back and dims the histogram when pressure is fading. Pressure that is still positive but decelerating is the condition that precedes most reversals in this kind of data, and a plain two-colour histogram hides it entirely.
The divergence layer compares confirmed price pivots against the delta total at those same bars. Divergences are confirmed rather than live: they appear only once the pivot's right-hand bars have elapsed, so they will always print a few bars after the turn.
How to use it
Built for intraday work on futures, and it functions on any symbol that reports volume.
Start with the reset mode. Session reset gives you the day's accumulated pressure and is the right default for intraday trading. Fixed length gives a rolling window. Running never resets and is only useful over short chart histories.
Read the relationship rather than the level. The absolute number means little on its own, since it depends on how long the total has been accumulating. What carries information is the direction of the total relative to price, whether it sits above or below its signal line, and whether the per-bar contribution is brightening or dimming.
The table reports the current bar's buy and sell split, the bar delta with an acceleration marker, the running total and which reset mode produced it, the signal-line relationship, relative volume, and raw volume.
What it cannot do
This is a proxy and not real order flow. It infers the aggressor side from the shape of the bar. It has no access to bid and ask data, no tick data, and no exchange-reported delta. On any instrument where true delta is available to you, the true delta is better and you should use that instead.
The directional wick reading is an assumption about intent, not a measurement. It is defensible and it is still an assumption, which is why the neutral model remains available.
With relative-volume weighting switched on, the running total is no longer in contracts or shares, because each bar is scaled before being added. The shape of the line stays comparable across time; the units do not. Turn the weighting off if you need the axis to be literal.
The session reset follows the exchange's own daily session, so on futures it resets at the futures open rather than the equity open. That is correct for a futures instrument and worth knowing if you apply the script elsewhere.
Divergences are confirmed, which means late by design. They describe a turn that has already formed. They are not predictions and no claim is made about how often they resolve favourably.
On authorship
Cumulative volume delta, relative volume and pivot divergence are all public methodology and I have said so plainly. The implementation is not borrowed. Every line is written from scratch and no code in it is copied or adapted from another author's script, on this platform or anywhere else.
Settings
Proxy model selection; reset mode with a fixed-length option, signal line length and type; display mode for line, histogram or both, acceleration colouring and its lookback, and the zero fill; relative-volume weighting with its average length, type and spike threshold; divergence toggle with pivot left and right bars; and table position, size and colours.
What it does
Volume delta estimates how much of a bar's volume was buyer-initiated versus seller-initiated, then accumulates the difference into a running total. When that total rises while price stalls, buyers are absorbing supply. When it falls while price grinds higher, the advance is not being paid for. This plots that total, colours each bar's contribution by whether the pressure is building or fading, marks unusually heavy volume, and flags divergences between the total and price.
What is different here
Cumulative volume delta is a public idea with many open-source implementations on this platform, and I claim no ownership of it. What differs is how the volume gets attributed.
Almost every delta proxy splits a bar by where the close sits within the range. That treats both wicks as neutral, which is a choice, and usually an unexamined one. It says the volume in a long lower wick carries the same meaning as volume in a long upper wick.
This one reads wicks directionally. On an up bar, the lower wick is treated as selling that buyers absorbed and overcame, so most of that volume is credited to buyers, while the upper wick is treated as rejection and mostly credited to sellers. On a down bar the reading inverts. The split is 75/25 rather than 50/50, and the body always goes to the direction the bar closed.
Whether that assumption is better than the neutral one is something you should decide rather than take on faith, so the classic model, the directional model, and an average of the two are all selectable from one dropdown. Switch between them on your own instrument and see whether the difference matters. If it does not, use the classic one.
How the parts work together
Four components share one job, which is why they sit in one script rather than four.
The delta engine produces the per-bar reading. The relative-volume layer scales that reading by how heavy the bar was against its own recent average, using a square root so a four-times-volume bar counts double rather than quadruple. That matters because a large delta on thin volume is noise and a moderate delta on heavy volume is participation, and an unweighted total treats them as equal.
The acceleration colouring compares each bar's delta to its own reading a few bars back and dims the histogram when pressure is fading. Pressure that is still positive but decelerating is the condition that precedes most reversals in this kind of data, and a plain two-colour histogram hides it entirely.
The divergence layer compares confirmed price pivots against the delta total at those same bars. Divergences are confirmed rather than live: they appear only once the pivot's right-hand bars have elapsed, so they will always print a few bars after the turn.
How to use it
Built for intraday work on futures, and it functions on any symbol that reports volume.
Start with the reset mode. Session reset gives you the day's accumulated pressure and is the right default for intraday trading. Fixed length gives a rolling window. Running never resets and is only useful over short chart histories.
Read the relationship rather than the level. The absolute number means little on its own, since it depends on how long the total has been accumulating. What carries information is the direction of the total relative to price, whether it sits above or below its signal line, and whether the per-bar contribution is brightening or dimming.
The table reports the current bar's buy and sell split, the bar delta with an acceleration marker, the running total and which reset mode produced it, the signal-line relationship, relative volume, and raw volume.
What it cannot do
This is a proxy and not real order flow. It infers the aggressor side from the shape of the bar. It has no access to bid and ask data, no tick data, and no exchange-reported delta. On any instrument where true delta is available to you, the true delta is better and you should use that instead.
The directional wick reading is an assumption about intent, not a measurement. It is defensible and it is still an assumption, which is why the neutral model remains available.
With relative-volume weighting switched on, the running total is no longer in contracts or shares, because each bar is scaled before being added. The shape of the line stays comparable across time; the units do not. Turn the weighting off if you need the axis to be literal.
The session reset follows the exchange's own daily session, so on futures it resets at the futures open rather than the equity open. That is correct for a futures instrument and worth knowing if you apply the script elsewhere.
Divergences are confirmed, which means late by design. They describe a turn that has already formed. They are not predictions and no claim is made about how often they resolve favourably.
On authorship
Cumulative volume delta, relative volume and pivot divergence are all public methodology and I have said so plainly. The implementation is not borrowed. Every line is written from scratch and no code in it is copied or adapted from another author's script, on this platform or anywhere else.
Settings
Proxy model selection; reset mode with a fixed-length option, signal line length and type; display mode for line, histogram or both, acceleration colouring and its lookback, and the zero fill; relative-volume weighting with its average length, type and spike threshold; divergence toggle with pivot left and right bars; and table position, size and colours.
הערות שחרור
Two small fixes. Cumulative values, divergences, and alerts are unchanged.The histogram's acceleration fade now survives Both display mode. Previously, drawing the CVD line over the histogram flattened every column to one transparency, so accelerating and fading delta bars became indistinguishable exactly when both elements were on screen. Transparency is now additive: fading bars stay visibly dimmer whether or not the line is drawn over them.
The source header now states the daily-chart interaction plainly: on daily and higher charts, Session reset restarts on every bar, so CVD equals the bar's own delta there. Use Rolling Window or None on those charts.

כתב ויתור
המידע והפרסומים אינם מיועדים להיות, ואינם מהווים, ייעוץ או המלצה פיננסית, השקעתית, מסחרית או מכל סוג אחר המסופקת או מאושרת על ידי TradingView. קרא עוד ב־תנאי השימוש.
כתב ויתור
המידע והפרסומים אינם מיועדים להיות, ואינם מהווים, ייעוץ או המלצה פיננסית, השקעתית, מסחרית או מכל סוג אחר המסופקת או מאושרת על ידי TradingView. קרא עוד ב־תנאי השימוש.