OPEN-SOURCE SCRIPT
Market Correlation Matrix [NikaQuant]
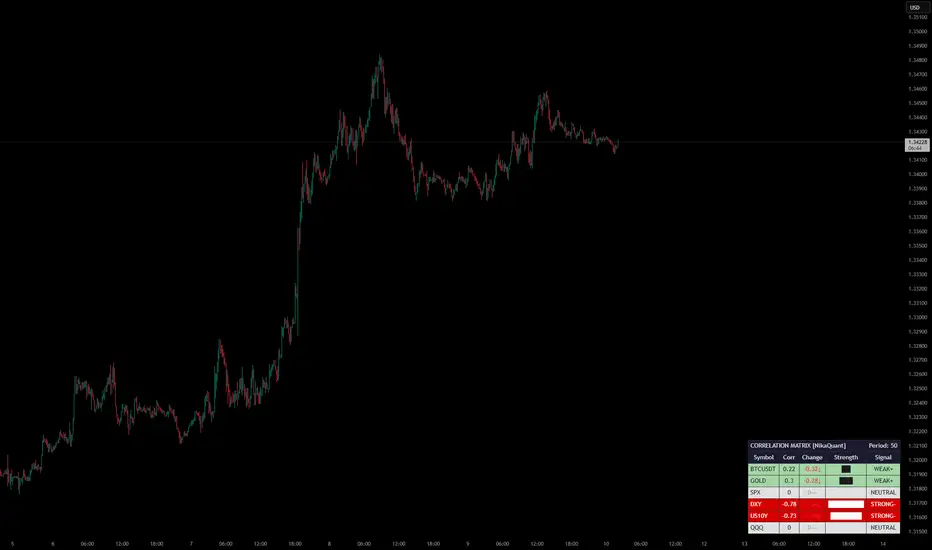
Market Correlation Matrix [NikaQuant]
A real-time correlation dashboard that displays Pearson correlation coefficients between the current chart symbol and up to 6 user-defined comparison symbols.
═══ FEATURES ═══
• Track correlations for up to 6 symbols simultaneously (default: BTCUSDT, GOLD, SPX, DXY, US10Y, QQQ)
• Heatmap-colored table with intuitive color coding from strong positive (green) to strong negative (red)
• Correlation change tracking — see how correlations are shifting over a configurable lookback period
• Visual strength bars showing absolute correlation magnitude at a glance
• Signal classification labels: STRONG+/-, MOD+/-, WEAK+/-, NEUTRAL
• Built-in alerts for strong positive/negative crosses (±0.7) and zero-line crosses
• Fully customizable: table position, text size, all colors, border styling
═══ HOW IT WORKS ═══
The indicator calculates Pearson correlation over a user-defined period (default: 50 bars) between the chart’s close price and each comparison symbol’s close price. It then renders a compact table showing:
1. Symbol — Ticker of the comparison asset
2. Corr — Current correlation value (-1 to +1)
3. Change — How much the correlation shifted vs N bars ago (with directional arrows)
4. Strength — Block-style visual bar representing absolute correlation
5. Signal — Classification from NEUTRAL to STRONG+/-
═══ SETTINGS ═══
Symbols: Configure up to 6 comparison symbols (leave blank to skip)
Correlation Period: Lookback length for Pearson calculation (default: 50)
Change Lookback: Compare current vs past correlation (default: 10 bars)
Display: Table position, show/hide title
Style: Full color customization for heatmap, headers, borders, and change indicators
═══ ALERTS ═══
• Strong positive correlation cross (above +0.7) per symbol
• Strong negative correlation cross (below -0.7) per symbol
• Any symbol crossing the zero line
═══ USE CASES ═══
• Monitor intermarket relationships in real time
• Identify regime changes when correlations break down or strengthen
• Confirm or filter trade setups using cross-asset correlation context
• Track USD, bonds, equities, and crypto correlations from a single chart
A real-time correlation dashboard that displays Pearson correlation coefficients between the current chart symbol and up to 6 user-defined comparison symbols.
═══ FEATURES ═══
• Track correlations for up to 6 symbols simultaneously (default: BTCUSDT, GOLD, SPX, DXY, US10Y, QQQ)
• Heatmap-colored table with intuitive color coding from strong positive (green) to strong negative (red)
• Correlation change tracking — see how correlations are shifting over a configurable lookback period
• Visual strength bars showing absolute correlation magnitude at a glance
• Signal classification labels: STRONG+/-, MOD+/-, WEAK+/-, NEUTRAL
• Built-in alerts for strong positive/negative crosses (±0.7) and zero-line crosses
• Fully customizable: table position, text size, all colors, border styling
═══ HOW IT WORKS ═══
The indicator calculates Pearson correlation over a user-defined period (default: 50 bars) between the chart’s close price and each comparison symbol’s close price. It then renders a compact table showing:
1. Symbol — Ticker of the comparison asset
2. Corr — Current correlation value (-1 to +1)
3. Change — How much the correlation shifted vs N bars ago (with directional arrows)
4. Strength — Block-style visual bar representing absolute correlation
5. Signal — Classification from NEUTRAL to STRONG+/-
═══ SETTINGS ═══
Symbols: Configure up to 6 comparison symbols (leave blank to skip)
Correlation Period: Lookback length for Pearson calculation (default: 50)
Change Lookback: Compare current vs past correlation (default: 10 bars)
Display: Table position, show/hide title
Style: Full color customization for heatmap, headers, borders, and change indicators
═══ ALERTS ═══
• Strong positive correlation cross (above +0.7) per symbol
• Strong negative correlation cross (below -0.7) per symbol
• Any symbol crossing the zero line
═══ USE CASES ═══
• Monitor intermarket relationships in real time
• Identify regime changes when correlations break down or strengthen
• Confirm or filter trade setups using cross-asset correlation context
• Track USD, bonds, equities, and crypto correlations from a single chart
סקריפט קוד פתוח
ברוח האמיתית של TradingView, יוצר הסקריפט הזה הפך אותו לקוד פתוח, כך שסוחרים יוכלו לעיין בו ולאמת את פעולתו. כל הכבוד למחבר! אמנם ניתן להשתמש בו בחינם, אך זכור כי פרסום חוזר של הקוד כפוף ל־כללי הבית שלנו.

כתב ויתור
המידע והפרסומים אינם מיועדים להיות, ואינם מהווים, ייעוץ או המלצה פיננסית, השקעתית, מסחרית או מכל סוג אחר המסופקת או מאושרת על ידי TradingView. קרא עוד ב־תנאי השימוש.
סקריפט קוד פתוח
ברוח האמיתית של TradingView, יוצר הסקריפט הזה הפך אותו לקוד פתוח, כך שסוחרים יוכלו לעיין בו ולאמת את פעולתו. כל הכבוד למחבר! אמנם ניתן להשתמש בו בחינם, אך זכור כי פרסום חוזר של הקוד כפוף ל־כללי הבית שלנו.
כתב ויתור
המידע והפרסומים אינם מיועדים להיות, ואינם מהווים, ייעוץ או המלצה פיננסית, השקעתית, מסחרית או מכל סוג אחר המסופקת או מאושרת על ידי TradingView. קרא עוד ב־תנאי השימוש.