OPEN-SOURCE SCRIPT
Fibonacci Master [SimpleAlgo]
🌀 FIBONACCI, SIMPLIFIED
INTRODUCING THE FIBONACCI MASTER
Everyone draws the same two points and gets a different fib. The swing is a judgement call, the levels are only as good as the swing, the golden zone is an assumption carried from chart to chart, and once the lines are drawn nobody writes down whether the pullback actually held.
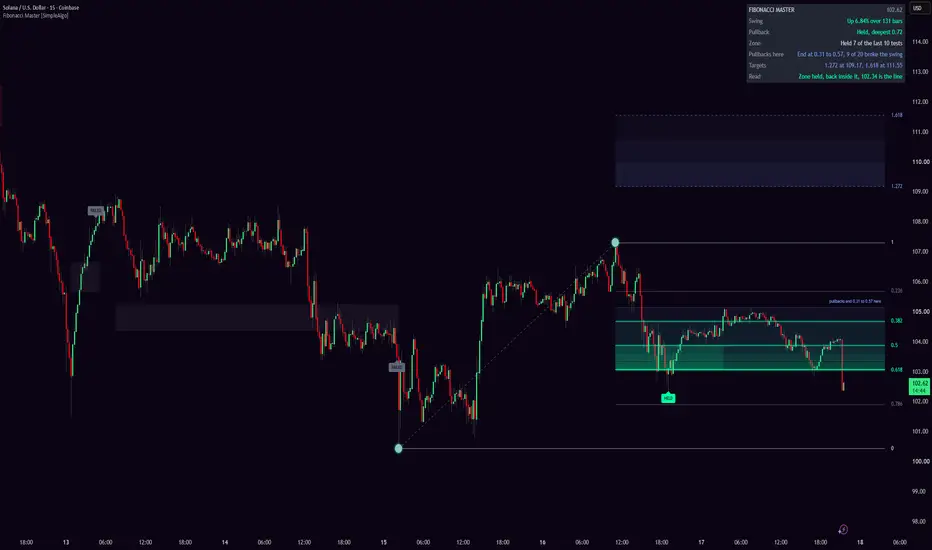
Fibonacci Master draws it for you, then measures instead of assuming. It finds the swing that matters, draws the retracement from it, lights up the 0.5 to 0.618 zone and projects the 1.272 and 1.618 targets. Every pullback on the chart is recorded as a fraction of its swing, so the chart carries its own answer to the question the zone only guesses at: where do pullbacks actually end here, and how many don't end at all? That answer is drawn as a band beside the classic zone and read back in the panel as "End at 0.34 to 0.52, 3 of 20 broke the swing". Every pullback into the zone is a test, judged on closes, tagged HELD or FAILED, boxed where it happened and counted. A hold locks the swing so the targets stay put, and whether the target was reached is counted too.

The swing is a dashed line between two dots, so you always see which two points the levels come from. Retracement levels run from the swing end to the right, the 0 and 1 lines from their own bars, the zone is a soft band that darkens toward 0.618, the measured band is dotted in blue, and the targets sit beyond the swing as a faint glow. Past zones stay on the chart as faint boxes coloured by what happened in them. The panel says it in words: the swing, how far price has pulled back and whether that is shallow or deep for this chart, the zone's record, where pullbacks end here, the two targets, and a one-line read. Six alerts cover the events.
🎯 The zone and the band
The 0.5 to 0.618 band is the part of the retracement traders actually trade, so it is the part the script draws in colour and judges. The dotted band next to it is this chart's own version of the same idea: the middle half of where the last twenty pullbacks ended, leaving out the ones that never ended because they broke the swing. On a chart that respects the golden zone the two overlap. On a chart where pullbacks end at 0.3, or run to 0.75, you see it before you trade it.
💡 What's different
An auto fib tool picks two points and draws seven lines. This one also knows when the swing should change, holds the levels still while a held pullback plays out toward its targets, measures where pullbacks on this chart really end, and remembers what happened the last ten times price reached the zone and the last ten times it held. The levels are the standard ones. The judgement around them is the work.
⚙️ HOW IT WORKS
📐 1. The swing
There is one swing at a time, and it has a direction. An up swing runs from its start low to the highest high since; the high moves every time price makes a new one. Pullbacks along the way do one of two things. A dip smaller than a swing just extends the swing. A pullback as big as a swing itself is a swing low in its own right, and once price makes a new high past it, it registers:
Pine Script®
Pine Script®
The swing then restarts from the most recent registered low that gives a full-size swing to the current high:
Pine Script®
So the fib is always on the latest leg that is big enough to matter, not on a two-month-old low and not on the last twitch. A swing size of four ATRs is the default, and it is the only number you need to set.
🔄 2. When the swing flips
A pullback that closes past 0.786 isn't a pullback any more; it has become the swing. The script flips: the old high becomes the start of a down swing, the running low is its end, and the levels redraw from there. A swing that is still forming, below the minimum size, flips only on a close past its start:
Pine Script®
This is what keeps the chart honest after a deep retrace. Price that ran back 95% of a swing and stalled was never going to be read as a pullback by anyone, so the script doesn't either.
📏 3. The levels
Every level is a fraction of the swing measured back from its end, so the same line works for up swings and down swings:
Pine Script®
The targets are the same fraction carried past the end:
Pine Script®
Levels appear once the swing is at least the minimum size. Before that the panel says "Forming" and shows how far along it is.
🧪 4. The test
A pullback becomes a test the moment a wick reaches the 0.5 line:
Pine Script®
From there it is judged on closes. A close back past 0.382 and the zone held; a close past 0.786 and it failed:
Pine Script®
A new high while the test is open counts as held, and a flip while it is open counts as failed. One test per pullback: once it is judged, the zone is not re-armed until price makes a new high, the swing flips, or a held low is lost, which is a retest and counts as one. The tag goes on the wick that made the test, below the low for an up swing and above the high for a down swing, and a faint box stays where the zone was, mint or pink if it held and grey if it failed, so the record is something you can see as well as read.
🔒 5. The lock
When a test holds, the swing is locked:
Pine Script®
The end stops moving, so when price goes on to new highs the levels and the two targets stay where they were, which is the whole reason you drew the fib. The lock releases when price reaches 1.618, when a close loses the low that held, or when price pulls back a full swing and makes a new high after it. In the first and last case the swing restarts from the low that held:
Pine Script®
📊 6. The zone record
Each judged test is one entry, held or failed, and the last ten are kept:
Pine Script®
The panel reads it back as "Held 7 of the last 10 tests". When the record is lopsided it says so in the read: "they tend to hold here" at seven or more, "they tend to fail here" at three or fewer.
📍 7. Where pullbacks end here
This is the part no fib tool has. A pullback ends the moment price makes a new extreme past the swing end, and at that moment its depth is known exactly: the distance from the swing end to the pullback low, as a fraction of the swing at that time. Dips shallower than 0.236 are noise, not pullbacks, and are left out. Everything else is recorded:
Pine Script®
A pullback that held and then ran to the targets is recorded at the depth it held. A pullback that flipped the swing never ended; it is recorded too, flagged as having broken the swing, and kept out of the band so the band only describes pullbacks that actually ended. The last twenty are kept, and the band is the middle half of the ones that ended, the 25th to the 75th percentile:
Pine Script®
The band is drawn on the current swing as two dotted blue lines with a label above their right end, and the panel says "End at 0.34 to 0.52, 3 of 20 broke the swing". The current pullback is then described against it: less than usual here, usual here, or more than usual here. It is measured per chart and per timeframe, because that is where it differs. An index on the hourly and a meme coin on the 5-minute do not pull back the same way, and the classic zone cannot know that.

🏁 8. The target record
A hold is only worth something if the swing then goes somewhere. So every hold is followed up: did price reach 1.272 before the held low was lost? That verdict is recorded when the lock releases:
Pine Script®
The last ten are kept, and while a swing is locked the read carries it: "Zone held, next target 1.272 at 4,204, hit after 6 of the last 8 holds". A zone that holds and then goes nowhere is a different zone from one that holds and runs, and the chart now tells you which one you are looking at.
🪟 9. The panel
The pullback ratio is measured from the swing end to the deepest point reached, not to the current close, because that is what a fib pullback means:
Pine Script®
🎨 Repainting
The swing end follows the live bar, so on the live bar the 1 line, every retracement level, the band and the targets can move until the close, and a test, a verdict or a flip that happens on the live bar can be undone before it closes. The panel says "confirms on close" next to any of those. Once a bar closes, nothing about it changes: the tags, the boxes, the records and the swing history are final. The script only ever draws the current swing's levels; the tags and boxes are the history.
✨ WHY IT IS ORIGINAL
The retracement is a century old and we have not touched it. What is new is everything around it. The swing is chosen by a rule you can read, in ATRs, so the same setting gives sensible swings on a 5-minute chart and a daily, and the swing knows when to restart and when to flip, so the fib on the chart is the one you would have drawn, not the one from last month. A held pullback locks the levels so the targets mean something after the breakout. Every pullback's depth is measured and kept, so beside the golden zone everybody draws sits the band this chart actually produces. And every visit to the zone is judged by closes and counted, then followed to the target and counted again, so the chart carries its own record of whether the zone is a place pullbacks end here, and whether holding it leads anywhere. An auto fib, a highlighted zone and a label each exist on their own. The swing logic, the lock, the measured band and the two records, read back in plain words, are what none of them give you.
🧭 HOW TO USE IT
👀 Read the swing first
The dashed line is the trade's context. "Up 2.9% over 69 bars" is a different market from "Up 0.4% over 9 bars". If the swing on the chart isn't the one you would have drawn, the swing size setting is the knob: smaller for faster legs, larger for bigger structure.
🔵 Then the band
Before you trust the golden zone on a chart, look at where the dotted band sits. If it covers 0.5 to 0.618, this chart behaves the way the textbook says and the zone is the place. If it sits at 0.3 to 0.45, pullbacks here are shallow and waiting for 0.618 means missing the move. If it runs to 0.75, pullbacks here go deep and the zone is a place to be patient, not early. Next to it, "6 of 20 broke the swing" is how often a pullback here turned out not to be one. The panel tells you whether the current pullback is less than usual, usual or more than usual for this chart, which is the same comparison in a few words.
↩️ Then the pullback
Price pulling back 0.3 into an up swing with the zone two ATRs lower is not yet a setup; it is a market deciding. The read tells you how far away the zone is in ATRs. Price in the zone is the moment: the read says what close it needs to hold.
📒 Then the records
If the zone held 8 of the last 10 tests on this chart, buying it with a stop past 0.786 has been the right side lately. If it held 3 of 10, the zone has been where the swing dies here, and the read will tell you so. Then the second record: if holds reached 1.272 only 2 of the last 8 times, the zone holds but the swing doesn't run, and your target should be nearer. Take the numbers at face value and let them argue with your habit.
🚀 The targets
After a hold, the two targets are where the swing would carry if the pullback was what it looked like. They stay in place until price gets there or the held low is lost. 1.272 is the common first target; 1.618 is the full extension.
⏱️ Timeframes
Nothing in the script is tied to a timeframe, because the swing size is in ATRs. On a 5-minute chart swings are a session long and the zone gets tested daily; on a daily chart a swing is months and the records take a long time to fill. Lower timeframes also flip more often, because a 0.786 retrace is a smaller move. Read the counts next to the numbers.

🌱 If you're new
Three sentences. The dashed line is the last big move, the coloured band is where that move's pullbacks are supposed to end, and the dotted band is where they actually end on this chart. The tags say whether the last pullbacks held, and the panel tells you how far back price has come, whether that is usual for this chart, and where price would go next if the zone holds.
None of this predicts where price goes. A fib level is a place to look, not a promise, and a record of ten tests is a tendency, not a law. Use it with your own analysis and manage your risk.
🛠️ SETTINGS
〰️ Swing
🖌️ Look
The rules behind the records are fixed: the zone is 0.5 to 0.618, a hold is a close back past 0.382, a fail is a close past 0.786, a pullback is at least 0.236 deep, and the memory is ten tests and twenty pullbacks:
Pine Script®
Those numbers are right or wrong rather than a matter of taste, and we would rather you didn't have to think about them.
🔔 ALERTS
Set them to "Once per bar close". A test or a verdict on a live bar can still be undone before the close.
📝 NOTES AND LIMITS
⚠️ DISCLAIMER
This script is for education and information. It isn't financial advice, a recommendation to buy or sell anything, or a promise about what any market will do. Past behaviour of a market, a method or an indicator doesn't guarantee future results, and nothing on this chart replaces your own judgement. Trading involves risk and you are responsible for your decisions.
INTRODUCING THE FIBONACCI MASTER
Everyone draws the same two points and gets a different fib. The swing is a judgement call, the levels are only as good as the swing, the golden zone is an assumption carried from chart to chart, and once the lines are drawn nobody writes down whether the pullback actually held.
Fibonacci Master draws it for you, then measures instead of assuming. It finds the swing that matters, draws the retracement from it, lights up the 0.5 to 0.618 zone and projects the 1.272 and 1.618 targets. Every pullback on the chart is recorded as a fraction of its swing, so the chart carries its own answer to the question the zone only guesses at: where do pullbacks actually end here, and how many don't end at all? That answer is drawn as a band beside the classic zone and read back in the panel as "End at 0.34 to 0.52, 3 of 20 broke the swing". Every pullback into the zone is a test, judged on closes, tagged HELD or FAILED, boxed where it happened and counted. A hold locks the swing so the targets stay put, and whether the target was reached is counted too.
The swing is a dashed line between two dots, so you always see which two points the levels come from. Retracement levels run from the swing end to the right, the 0 and 1 lines from their own bars, the zone is a soft band that darkens toward 0.618, the measured band is dotted in blue, and the targets sit beyond the swing as a faint glow. Past zones stay on the chart as faint boxes coloured by what happened in them. The panel says it in words: the swing, how far price has pulled back and whether that is shallow or deep for this chart, the zone's record, where pullbacks end here, the two targets, and a one-line read. Six alerts cover the events.
🎯 The zone and the band
The 0.5 to 0.618 band is the part of the retracement traders actually trade, so it is the part the script draws in colour and judges. The dotted band next to it is this chart's own version of the same idea: the middle half of where the last twenty pullbacks ended, leaving out the ones that never ended because they broke the swing. On a chart that respects the golden zone the two overlap. On a chart where pullbacks end at 0.3, or run to 0.75, you see it before you trade it.
💡 What's different
An auto fib tool picks two points and draws seven lines. This one also knows when the swing should change, holds the levels still while a held pullback plays out toward its targets, measures where pullbacks on this chart really end, and remembers what happened the last ten times price reached the zone and the last ten times it held. The levels are the standard ones. The judgement around them is the work.
⚙️ HOW IT WORKS
📐 1. The swing
There is one swing at a time, and it has a direction. An up swing runs from its start low to the highest high since; the high moves every time price makes a new one. Pullbacks along the way do one of two things. A dip smaller than a swing just extends the swing. A pullback as big as a swing itself is a swing low in its own right, and once price makes a new high past it, it registers:
The swing then restarts from the most recent registered low that gives a full-size swing to the current high:
So the fib is always on the latest leg that is big enough to matter, not on a two-month-old low and not on the last twitch. A swing size of four ATRs is the default, and it is the only number you need to set.
🔄 2. When the swing flips
A pullback that closes past 0.786 isn't a pullback any more; it has become the swing. The script flips: the old high becomes the start of a down swing, the running low is its end, and the levels redraw from there. A swing that is still forming, below the minimum size, flips only on a close past its start:
This is what keeps the chart honest after a deep retrace. Price that ran back 95% of a swing and stalled was never going to be read as a pullback by anyone, so the script doesn't either.
📏 3. The levels
Every level is a fraction of the swing measured back from its end, so the same line works for up swings and down swings:
The targets are the same fraction carried past the end:
Levels appear once the swing is at least the minimum size. Before that the panel says "Forming" and shows how far along it is.
🧪 4. The test
A pullback becomes a test the moment a wick reaches the 0.5 line:
From there it is judged on closes. A close back past 0.382 and the zone held; a close past 0.786 and it failed:
A new high while the test is open counts as held, and a flip while it is open counts as failed. One test per pullback: once it is judged, the zone is not re-armed until price makes a new high, the swing flips, or a held low is lost, which is a retest and counts as one. The tag goes on the wick that made the test, below the low for an up swing and above the high for a down swing, and a faint box stays where the zone was, mint or pink if it held and grey if it failed, so the record is something you can see as well as read.
🔒 5. The lock
When a test holds, the swing is locked:
The end stops moving, so when price goes on to new highs the levels and the two targets stay where they were, which is the whole reason you drew the fib. The lock releases when price reaches 1.618, when a close loses the low that held, or when price pulls back a full swing and makes a new high after it. In the first and last case the swing restarts from the low that held:
📊 6. The zone record
Each judged test is one entry, held or failed, and the last ten are kept:
The panel reads it back as "Held 7 of the last 10 tests". When the record is lopsided it says so in the read: "they tend to hold here" at seven or more, "they tend to fail here" at three or fewer.
📍 7. Where pullbacks end here
This is the part no fib tool has. A pullback ends the moment price makes a new extreme past the swing end, and at that moment its depth is known exactly: the distance from the swing end to the pullback low, as a fraction of the swing at that time. Dips shallower than 0.236 are noise, not pullbacks, and are left out. Everything else is recorded:
A pullback that held and then ran to the targets is recorded at the depth it held. A pullback that flipped the swing never ended; it is recorded too, flagged as having broken the swing, and kept out of the band so the band only describes pullbacks that actually ended. The last twenty are kept, and the band is the middle half of the ones that ended, the 25th to the 75th percentile:
The band is drawn on the current swing as two dotted blue lines with a label above their right end, and the panel says "End at 0.34 to 0.52, 3 of 20 broke the swing". The current pullback is then described against it: less than usual here, usual here, or more than usual here. It is measured per chart and per timeframe, because that is where it differs. An index on the hourly and a meme coin on the 5-minute do not pull back the same way, and the classic zone cannot know that.
🏁 8. The target record
A hold is only worth something if the swing then goes somewhere. So every hold is followed up: did price reach 1.272 before the held low was lost? That verdict is recorded when the lock releases:
The last ten are kept, and while a swing is locked the read carries it: "Zone held, next target 1.272 at 4,204, hit after 6 of the last 8 holds". A zone that holds and then goes nowhere is a different zone from one that holds and runs, and the chart now tells you which one you are looking at.
🪟 9. The panel
- Swing: direction, size in percent, and how many bars it took.
- Pullback: how far back price has come as a ratio of the swing, where that is (shallow, near the zone, in the zone, past the zone, deep), and whether that is less than usual, usual or more than usual for this chart. After a hold it says "Held, deepest 0.58".
- Zone: the record, out of the last ten tests.
- Pullbacks here: the measured band, and how many of the last twenty pullbacks broke the swing instead of ending.
- Targets: 1.272 and 1.618 as prices, and which have been hit.
- Read: one line. "Pulling back, 0.31 so far, zone 1.9 ATR away", "In the zone, needs a close above 4,163 to hold", "Zone held, buyers back in", "Zone held, next target 1.272 at 4,204, hit after 6 of the last 8 holds", "Past the zone, 4,151 is the last line", "Swing flipped, now down".
The pullback ratio is measured from the swing end to the deepest point reached, not to the current close, because that is what a fib pullback means:
🎨 Repainting
The swing end follows the live bar, so on the live bar the 1 line, every retracement level, the band and the targets can move until the close, and a test, a verdict or a flip that happens on the live bar can be undone before it closes. The panel says "confirms on close" next to any of those. Once a bar closes, nothing about it changes: the tags, the boxes, the records and the swing history are final. The script only ever draws the current swing's levels; the tags and boxes are the history.
✨ WHY IT IS ORIGINAL
The retracement is a century old and we have not touched it. What is new is everything around it. The swing is chosen by a rule you can read, in ATRs, so the same setting gives sensible swings on a 5-minute chart and a daily, and the swing knows when to restart and when to flip, so the fib on the chart is the one you would have drawn, not the one from last month. A held pullback locks the levels so the targets mean something after the breakout. Every pullback's depth is measured and kept, so beside the golden zone everybody draws sits the band this chart actually produces. And every visit to the zone is judged by closes and counted, then followed to the target and counted again, so the chart carries its own record of whether the zone is a place pullbacks end here, and whether holding it leads anywhere. An auto fib, a highlighted zone and a label each exist on their own. The swing logic, the lock, the measured band and the two records, read back in plain words, are what none of them give you.
🧭 HOW TO USE IT
👀 Read the swing first
The dashed line is the trade's context. "Up 2.9% over 69 bars" is a different market from "Up 0.4% over 9 bars". If the swing on the chart isn't the one you would have drawn, the swing size setting is the knob: smaller for faster legs, larger for bigger structure.
🔵 Then the band
Before you trust the golden zone on a chart, look at where the dotted band sits. If it covers 0.5 to 0.618, this chart behaves the way the textbook says and the zone is the place. If it sits at 0.3 to 0.45, pullbacks here are shallow and waiting for 0.618 means missing the move. If it runs to 0.75, pullbacks here go deep and the zone is a place to be patient, not early. Next to it, "6 of 20 broke the swing" is how often a pullback here turned out not to be one. The panel tells you whether the current pullback is less than usual, usual or more than usual for this chart, which is the same comparison in a few words.
↩️ Then the pullback
Price pulling back 0.3 into an up swing with the zone two ATRs lower is not yet a setup; it is a market deciding. The read tells you how far away the zone is in ATRs. Price in the zone is the moment: the read says what close it needs to hold.
📒 Then the records
If the zone held 8 of the last 10 tests on this chart, buying it with a stop past 0.786 has been the right side lately. If it held 3 of 10, the zone has been where the swing dies here, and the read will tell you so. Then the second record: if holds reached 1.272 only 2 of the last 8 times, the zone holds but the swing doesn't run, and your target should be nearer. Take the numbers at face value and let them argue with your habit.
🚀 The targets
After a hold, the two targets are where the swing would carry if the pullback was what it looked like. They stay in place until price gets there or the held low is lost. 1.272 is the common first target; 1.618 is the full extension.
⏱️ Timeframes
Nothing in the script is tied to a timeframe, because the swing size is in ATRs. On a 5-minute chart swings are a session long and the zone gets tested daily; on a daily chart a swing is months and the records take a long time to fill. Lower timeframes also flip more often, because a 0.786 retrace is a smaller move. Read the counts next to the numbers.
🌱 If you're new
Three sentences. The dashed line is the last big move, the coloured band is where that move's pullbacks are supposed to end, and the dotted band is where they actually end on this chart. The tags say whether the last pullbacks held, and the panel tells you how far back price has come, whether that is usual for this chart, and where price would go next if the zone holds.
None of this predicts where price goes. A fib level is a place to look, not a promise, and a record of ten tests is a tendency, not a law. Use it with your own analysis and manage your risk.
🛠️ SETTINGS
〰️ Swing
- Swing size (ATR): 4 by default. The smallest move that counts as a swing. Levels appear once the swing is this tall, and a pullback this deep followed by a new high restarts the swing from the pullback low. Lower it for faster legs, raise it for bigger structure.
🖌️ Look
- Theme: Neon, Classic, Aurora, Ice, or Custom with your own up and down colours.
- Brightness: 1 to 5, for your screen and background.
- Targets: the 1.272 and 1.618 lines and the glow between them. On by default.
- Where pullbacks end here: the dotted band. On by default.
- Swing line: the dashed line and dots. On by default.
- Past zones: the faint boxes where judged zones sat. On by default.
- HELD / FAILED tags and Level labels: on by default.
- Extend right (bars): how far the levels reach past the last bar.
- Panel: position and size.
The rules behind the records are fixed: the zone is 0.5 to 0.618, a hold is a close back past 0.382, a fail is a close past 0.786, a pullback is at least 0.236 deep, and the memory is ten tests and twenty pullbacks:
Those numbers are right or wrong rather than a matter of taste, and we would rather you didn't have to think about them.
🔔 ALERTS
- In the zone: price pulled into the 0.5 to 0.618 zone.
- Zone held: a close back past 0.382.
- Zone failed: a close past 0.786.
- 1.272 hit: price reached the first target after a hold.
- 1.618 hit: price reached the second.
- New swing: the swing flipped.
Set them to "Once per bar close". A test or a verdict on a live bar can still be undone before the close.
📝 NOTES AND LIMITS
- The swing end is the running extreme, so the 1 line and every level move while the swing is still making new highs. That is the swing growing, not the script changing its mind. The levels settle once price pulls back.
- When the swing restarts or flips, the whole fib redraws. The old levels are not kept; the tags and boxes are.
- Wicks start a test, closes judge it. A wick to 0.83 that closes back above 0.786 and then above 0.382 is a hold, and the panel will say "Held, deepest 0.83".
- The band is the middle half of the pullbacks that ended, so a quarter of them ended above it and a quarter below. It needs five ended pullbacks before it is drawn, and it is only as settled as the count next to it.
- Pullbacks that broke the swing are not in the band, because they never ended. They are in the count next to it, and leaving that count out would make every chart look like it respects the zone.
- The swing size is in ATRs, so a volatility spike raises the bar for what counts as a swing for the next few bars. On a crash candle the chart can look like it ignored an obvious pullback; it was below the size at the time.
- The zone record counts tests, not pullbacks. A pullback that never reaches 0.5 is not a test and is not scored, but it is measured for the band.
- Ten tests and twenty pullbacks are the memory, and on a daily chart that can be years. Read the counts.
- Different timeframes will often show different swings on the same symbol at the same moment, because a swing on the 5-minute chart is a dip on the hourly. That is what you would expect from two hand-drawn fibs too.
- On the live bar a held or failed tag can appear and disappear until the close.
⚠️ DISCLAIMER
This script is for education and information. It isn't financial advice, a recommendation to buy or sell anything, or a promise about what any market will do. Past behaviour of a market, a method or an indicator doesn't guarantee future results, and nothing on this chart replaces your own judgement. Trading involves risk and you are responsible for your decisions.
סקריפט קוד פתוח
ברוח האמיתית של TradingView, יוצר הסקריפט הזה הפך אותו לקוד פתוח, כך שסוחרים יוכלו לעיין בו ולאמת את פעולתו. כל הכבוד למחבר! אמנם ניתן להשתמש בו בחינם, אך זכור כי פרסום חוזר של הקוד כפוף ל־כללי הבית שלנו.

Access our exclusive invite-only scripts: simplealgo.io
Join our discord: discord.gg/simplealgo
Join our discord: discord.gg/simplealgo
כתב ויתור
המידע והפרסומים אינם מיועדים להיות, ואינם מהווים, ייעוץ או המלצה פיננסית, השקעתית, מסחרית או מכל סוג אחר המסופקת או מאושרת על ידי TradingView. קרא עוד ב־תנאי השימוש.
סקריפט קוד פתוח
ברוח האמיתית של TradingView, יוצר הסקריפט הזה הפך אותו לקוד פתוח, כך שסוחרים יוכלו לעיין בו ולאמת את פעולתו. כל הכבוד למחבר! אמנם ניתן להשתמש בו בחינם, אך זכור כי פרסום חוזר של הקוד כפוף ל־כללי הבית שלנו.
Access our exclusive invite-only scripts: simplealgo.io
Join our discord: discord.gg/simplealgo
Join our discord: discord.gg/simplealgo
כתב ויתור
המידע והפרסומים אינם מיועדים להיות, ואינם מהווים, ייעוץ או המלצה פיננסית, השקעתית, מסחרית או מכל סוג אחר המסופקת או מאושרת על ידי TradingView. קרא עוד ב־תנאי השימוש.