OPEN-SOURCE SCRIPT
Volume Weighted Average Price [OmegaTools]
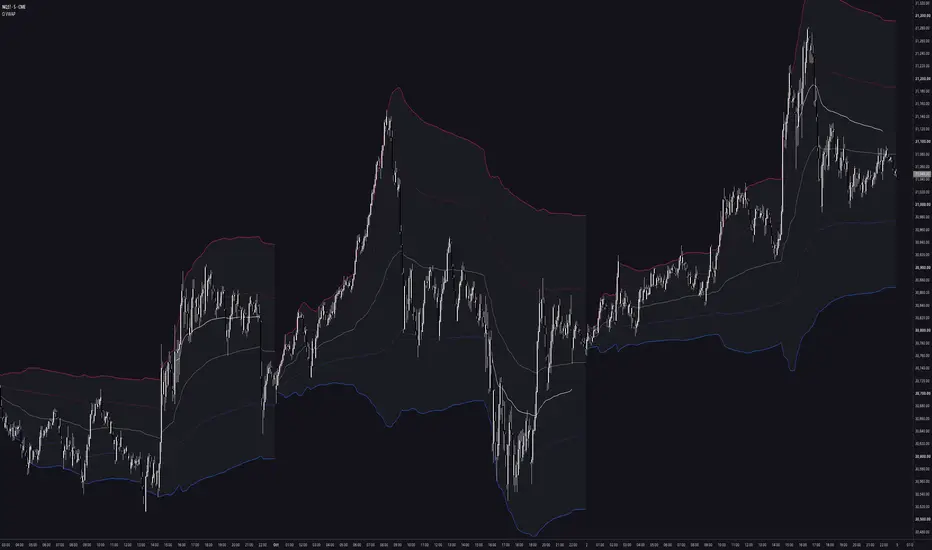
Ω VWAP — Omega Volume Weighted Average Price
Ω VWAP plots VWAP and its standard deviation bands on four independent anchors: Extended Hours (the full trading day), Regular Trading Hours, Weekly and Rolling. For the anchored periods it also draws the levels at which the previous period closed. Each anchor is configured separately, so the script works as a single clean VWAP or as a full map of intraday, cash-session and weekly value.
WHAT IT DOES
HOW IT WORKS
Anchored VWAP
From each anchor, the script keeps three running sums: Σ(p·v), Σv and Σ(p²·v). Here p is the bar's typical price (HLC3) and v is its volume. The VWAP is Σ(p·v) / Σv.
The band width is the volume-weighted standard deviation of price around the VWAP: √(Σ(p²·v) / Σv − VWAP²). The variance is floored at zero before the square root. This prevents invalid values caused by floating-point rounding when dispersion is close to zero, which typically happens on the first bars of a new period. Bands are plotted at VWAP ± 1σ and VWAP ± 2σ.
Anchors
Past levels
When an anchored period ends, its final VWAP and ±1σ/±2σ values are frozen. They are projected as horizontal lines across the next period:
The lines start at the new anchor and extend into the chart's future space, so the prior day's, prior session's and prior week's value levels are visible before price reaches them. If the next period starts before a projection has ended (for example, a week that opened late after a holiday), the previous set is trimmed at the new anchor so levels from different periods never overlap.
Fill modes
Fills work for both the current bands and the past levels. They require deviations to be displayed.
Custom Asset
When Custom Asset is enabled, the chart's volume is replaced by the volume of another symbol on the same timeframe. Price still comes from the chart. This lets you build a meaningful VWAP on instruments whose volume is missing or counts ticks only, for example by using CME futures volume on a broker's index CFD or on a cash index. Choose a symbol that tracks the same underlying and trades during the same hours.
HOW TO USE IT
SETTINGS
Every display is set to None by default. Enable only the anchors you need to keep the chart clean.
NOTES AND LIMITATIONS
The source code is open: study it, learn from it and adapt it to your own workflow.
This script is a technical analysis tool. It does not generate trading signals or give financial advice. How price has behaved around these levels in the past does not guarantee future results.
Ω VWAP plots VWAP and its standard deviation bands on four independent anchors: Extended Hours (the full trading day), Regular Trading Hours, Weekly and Rolling. For the anchored periods it also draws the levels at which the previous period closed. Each anchor is configured separately, so the script works as a single clean VWAP or as a full map of intraday, cash-session and weekly value.
WHAT IT DOES
- Four VWAP engines in one script: Extended Hour, RTH (09:30–16:00 New York), Weekly and Rolling.
- ±1σ and ±2σ volume-weighted standard deviation bands on every anchor.
- Previous-period levels (mean and bands) for the Extended Hour, RTH and Weekly anchors, drawn as horizontal lines across the current period.
- Five fill modes that highlight the extension zones, the value area, or both.
- An optional external volume source, so you can build a real VWAP on instruments with missing or tick-only volume (CFDs, cash indices, spot FX).
HOW IT WORKS
Anchored VWAP
From each anchor, the script keeps three running sums: Σ(p·v), Σv and Σ(p²·v). Here p is the bar's typical price (HLC3) and v is its volume. The VWAP is Σ(p·v) / Σv.
The band width is the volume-weighted standard deviation of price around the VWAP: √(Σ(p²·v) / Σv − VWAP²). The variance is floored at zero before the square root. This prevents invalid values caused by floating-point rounding when dispersion is close to zero, which typically happens on the first bars of a new period. Bands are plotted at VWAP ± 1σ and VWAP ± 2σ.
Anchors
- Extended Hour: resets at the start of each trading day as defined by the symbol's session. On futures, and on stocks with extended hours enabled, the day includes the overnight and pre-market session.
- Regular Trading Hours: resets on the first bar inside 09:30–16:00 America/New_York. Only volume traded inside RTH enters the calculation, and the bands are drawn only during RTH, so overnight activity never distorts the cash-session VWAP.
- Weekly: resets at the start of each trading week.
- Rolling: has no anchor and never resets. Instead of cumulative sums, it applies Wilder's moving average (RMA) to p·v, v and p²·v, so the VWAP and σ adapt continuously.
- Length presets are Short (11), Mid (34) and Long (50).
- Mix averages the VWAPs and σ computed on lengths 9, 21 and 55. This blends fast and slow volume-weighted value into one smoother reference.
Past levels
When an anchored period ends, its final VWAP and ±1σ/±2σ values are frozen. They are projected as horizontal lines across the next period:
- one trading day for Extended Hour;
- the 6.5-hour cash session for RTH;
- one week for Weekly.
The lines start at the new anchor and extend into the chart's future space, so the prior day's, prior session's and prior week's value levels are visible before price reaches them. If the next period starts before a projection has ended (for example, a week that opened late after a holiday), the previous set is trimmed at the new anchor so levels from different periods never overlap.
Fill modes
- Extensions: shades the zones between 1σ and 2σ. The upper zone uses the DN colour and the lower zone uses the UP colour.
- Area: shades the whole ±2σ envelope with a neutral tint of the MEAN colour.
- Internal: shades only the ±1σ core.
- Extensions & Area: a neutral ±1σ core plus coloured extension zones.
Fills work for both the current bands and the past levels. They require deviations to be displayed.
Custom Asset
When Custom Asset is enabled, the chart's volume is replaced by the volume of another symbol on the same timeframe. Price still comes from the chart. This lets you build a meaningful VWAP on instruments whose volume is missing or counts ticks only, for example by using CME futures volume on a broker's index CFD or on a cash index. Choose a symbol that tracks the same underlying and trades during the same hours.
HOW TO USE IT
- Fair value and control. VWAP is the average price paid per unit of volume since the anchor. Price holding above an anchor's VWAP shows that buyers have been in control over that period; price holding below it shows sellers have been.
- Balance vs. trend.
- In rotational conditions, price tends to oscillate inside ±1σ. The 1σ–2σ extensions then act as stretch zones where reversion toward VWAP becomes more likely.
- In trending conditions, price accepts beyond 1σ, and the VWAP or the 1σ band acts as dynamic support or resistance on pullbacks.
- Identifying which regime is in play is more useful than fading every band touch.
- Prior value. Past levels show where the previous day, cash session or week settled its value. Where the open sits relative to the prior VWAP and bands (above, inside or below) frames the session, and these levels are often retested as support or resistance.
- Multi-anchor confluence. When VWAPs or bands from different anchors converge (for example, the weekly VWAP near the prior RTH +1σ), the level reflects the cost basis of several groups of participants and is often watched more closely.
- RTH vs. Extended. On index futures, the RTH VWAP reflects cash-session participants and the Extended Hour VWAP reflects all participants, including overnight. Comparing the two shows whether overnight trading moved value away from where the cash session begins.
- Rolling VWAP. Use it on markets without a natural session, such as crypto, or on higher intraday timeframes. It gives an adaptive volume-weighted mean with dispersion bands that doesn't depend on an anchor.
SETTINGS
- Custom Asset: toggle and symbol for the external volume source.
- Current (each anchor): None / Mean / Deviations / Mean & Deviations for the live VWAP.
- Past (Extended Hour, RTH, Weekly): None / Mean / Deviations / Mean & Deviations for the previous-period levels.
- Fill: None / Extensions / Area / Internal / Extensions & Area, set separately for current and past.
- Length (Rolling): Mix / Short / Mid / Long.
- Colours: MEAN, UP (lower bands) and DN (upper bands), set per anchor.
Every display is set to None by default. Enable only the anchors you need to keep the chart clean.
NOTES AND LIMITATIONS
- The script is designed for intraday charts. On the daily timeframe and above, the Extended Hour anchor resets on every bar.
- The RTH anchor uses the New York cash session (09:30–16:00 ET) and is meant for US equities, indices and their futures.
- Use a timeframe whose bars align with 09:30 (30 minutes or lower).
- On hourly bars that open on the hour, RTH starts on the first bar that opens inside the window.
- The VWAP and bands are only as good as the volume data behind them. On symbols with tick volume or no volume, use Custom Asset.
- Past levels are drawn with line objects. To stay within TradingView's drawing limit, the oldest levels are removed automatically.
- The bands measure the dispersion of volume-weighted price. Intraday price distributions are not normal, so ±1σ and ±2σ should not be read as exact probabilities.
The source code is open: study it, learn from it and adapt it to your own workflow.
This script is a technical analysis tool. It does not generate trading signals or give financial advice. How price has behaved around these levels in the past does not guarantee future results.
סקריפט קוד פתוח
ברוח האמיתית של TradingView, יוצר הסקריפט הזה הפך אותו לקוד פתוח, כך שסוחרים יוכלו לעיין בו ולאמת את פעולתו. כל הכבוד למחבר! אמנם ניתן להשתמש בו בחינם, אך זכור כי פרסום חוזר של הקוד כפוף ל־כללי הבית שלנו.

כתב ויתור
המידע והפרסומים אינם מיועדים להיות, ואינם מהווים, ייעוץ או המלצה פיננסית, השקעתית, מסחרית או מכל סוג אחר המסופקת או מאושרת על ידי TradingView. קרא עוד ב־תנאי השימוש.
סקריפט קוד פתוח
ברוח האמיתית של TradingView, יוצר הסקריפט הזה הפך אותו לקוד פתוח, כך שסוחרים יוכלו לעיין בו ולאמת את פעולתו. כל הכבוד למחבר! אמנם ניתן להשתמש בו בחינם, אך זכור כי פרסום חוזר של הקוד כפוף ל־כללי הבית שלנו.
כתב ויתור
המידע והפרסומים אינם מיועדים להיות, ואינם מהווים, ייעוץ או המלצה פיננסית, השקעתית, מסחרית או מכל סוג אחר המסופקת או מאושרת על ידי TradingView. קרא עוד ב־תנאי השימוש.