מעודכן
[blackcat] L1 NinjaTrader Channel
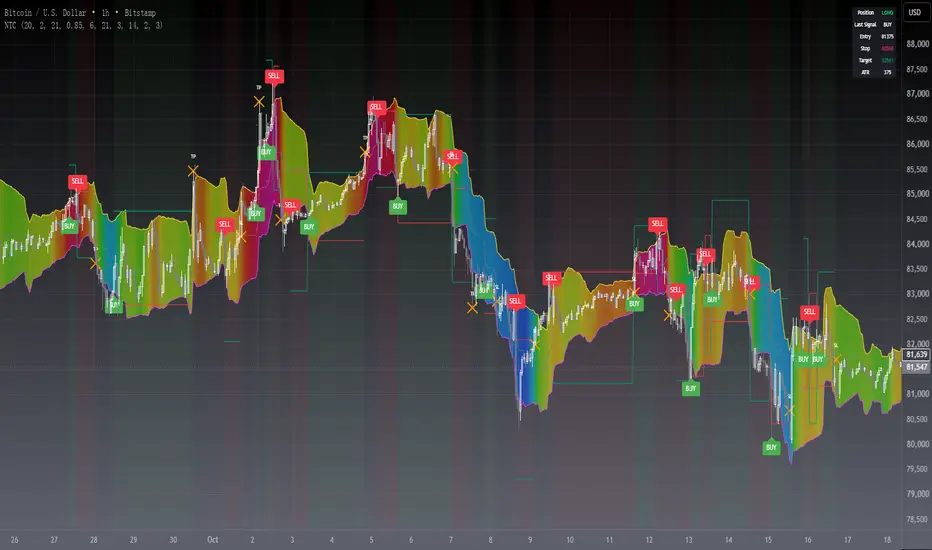
NinjaTrader is a popular charting software widely used for trading analysis and execution in financial markets such as stocks, futures, and forex. It provides rich features and tools to assist traders in technical analysis, trade strategy development, and trade execution. When I discovered a built-in channel technical indicator in NinjaTrader and became interested in it but didn't understand its principles, I utilized my extensive development experience to simulate a similar version based on its characteristics, naming it "Ninja Channel" for reference only. First, I observed the characteristics and behavior of the built-in channel indicator. Pay attention to how it calculates and plots the channels, as well as its parameter settings and usage methods. This information can help me better understand the principles and functions of this indicator. Then, I attempted to simulate a similar channel indicator using my existing knowledge of technical analysis tools. I used charting tools and indicators to plot and calculate the upper and lower boundaries of the channel according to my needs and preferences. Please remember that this simulated version is for reference only; there is no guarantee that it will be exactly identical to the built-in channel indicator in NinjaTrader. The original built-in indicator may have more complex calculation methods with more precise results. Therefore, before engaging in actual trading activities, it is recommended that you carefully study and understand the principles and usage methods of the original indicator.
The Ninja Channel belongs to a type of technical indicator used for analyzing price range fluctuations and trends. It constructs an upper-lower boundary channel based on high-low points or moving average line fluctuations of prices to assist traders in determining overbought/oversold zones, trend strength/weaknesses,and price reversal points.
The main uses of Ninja Channel include:
1.Trend determination: The Ninja Channel helps traders determine price trends.When prices are located above half partofthechannel,it indicates an uptrend; when prices are located below half partofthechannel,it indicates adowntrend. Traders can formulate corresponding trading strategies based on trend analysis.
2.Overbought/oversold zones: The upper and lower boundaries of the Ninja Channel can be used to determine overbought and oversold zones.When prices touch or exceed the upper boundary of the channel, it may indicate an overbought market condition with a potential price pullback or reversal; when prices touch or fall below the lower boundary of the channel, it may indicate an oversold market condition with a potential price rebound or reversal.Traders can develop counter-trend or reversal trading strategies based on these overbought/oversold zones.
3.Dynamic support and resistance: The upper and lower boundaries of the Ninja Channel can be seen as dynamic support and resistance levels.When prices approach the upper boundary ofthechannel,theupperboundarymay act asresistance, limiting upward price movement; when prices approachthelowerboundaryofthechannel,thelowerboundarymayactassupport,limiting downward price movement.Traderscanmake trading decisions based on these dynamic supportandresistancelevels.
Of course, for this newly created indicator,some aspects are still unfamiliar.However,the learning process can refer to some common channel-type technical indicators including Bollinger Bands,Keltner Channels,and Donchian Channels. Each indicator has its unique calculation method and parameter settings.Traderscan choose suitable indicators according to their own needsandpreferences.
In summary,NinjaChannel is a type of technical indicator used for analyzingprice range fluctuationsandtrends.It helps traders determine trends,overbought/oversoldzones,anddynamic support/resistance levels in order to formulate appropriate trading strategies.However,technicalindicatorsareonly auxiliary tools.Traderstill needsto consider other factorsandsrisk managementstrategiesinorder tomakemore informedtradingdecisions.
The Ninja Channel belongs to a type of technical indicator used for analyzing price range fluctuations and trends. It constructs an upper-lower boundary channel based on high-low points or moving average line fluctuations of prices to assist traders in determining overbought/oversold zones, trend strength/weaknesses,and price reversal points.
The main uses of Ninja Channel include:
1.Trend determination: The Ninja Channel helps traders determine price trends.When prices are located above half partofthechannel,it indicates an uptrend; when prices are located below half partofthechannel,it indicates adowntrend. Traders can formulate corresponding trading strategies based on trend analysis.
2.Overbought/oversold zones: The upper and lower boundaries of the Ninja Channel can be used to determine overbought and oversold zones.When prices touch or exceed the upper boundary of the channel, it may indicate an overbought market condition with a potential price pullback or reversal; when prices touch or fall below the lower boundary of the channel, it may indicate an oversold market condition with a potential price rebound or reversal.Traders can develop counter-trend or reversal trading strategies based on these overbought/oversold zones.
3.Dynamic support and resistance: The upper and lower boundaries of the Ninja Channel can be seen as dynamic support and resistance levels.When prices approach the upper boundary ofthechannel,theupperboundarymay act asresistance, limiting upward price movement; when prices approachthelowerboundaryofthechannel,thelowerboundarymayactassupport,limiting downward price movement.Traderscanmake trading decisions based on these dynamic supportandresistancelevels.
Of course, for this newly created indicator,some aspects are still unfamiliar.However,the learning process can refer to some common channel-type technical indicators including Bollinger Bands,Keltner Channels,and Donchian Channels. Each indicator has its unique calculation method and parameter settings.Traderscan choose suitable indicators according to their own needsandpreferences.
In summary,NinjaChannel is a type of technical indicator used for analyzingprice range fluctuationsandtrends.It helps traders determine trends,overbought/oversoldzones,anddynamic support/resistance levels in order to formulate appropriate trading strategies.However,technicalindicatorsareonly auxiliary tools.Traderstill needsto consider other factorsandsrisk managementstrategiesinorder tomakemore informedtradingdecisions.
הערות שחרור
update headerהערות שחרור
OVERVIEWThe [blackcat] L1 NinjaTrader Channel indicator is designed to help traders identify potential buying and selling opportunities by plotting dynamic channels based on price action and volatility. This script calculates an adaptive channel using the Average True Range (ATR) and plots it with a gradient fill that reflects market sentiment through RSI values 📈💹.
FEATURES
Calculates NinjaTrader Channels using customizable parameters:
Channel Length: Number of bars considered for calculating highs and lows.
Multiplier: Factor applied to ATR for determining channel width.
Plots Upper Channel and Lower Channel lines on the chart:
Upper Channel: Yellow line representing the upper boundary.
Lower Channel: Fuchsia line representing the lower boundary.
Fills the area between the channels with a gradient color reflecting RSI values:
Gradient colors range from blue (oversold) to red (overbought).
Displays 'Buy' and 'Sell' labels on the chart when conditions are met 🏷️
Generates alerts based on crossover events between price and channel boundaries 🔔
HOW TO USE
Add the indicator to your TradingView chart by selecting it from the indicators list.
Adjust the Channel Length and Multiplier parameters as needed to fine-tune the sensitivity of the channels ⚙️.
Monitor the chart for 'Buy' and 'Sell' labels indicating potential trade opportunities.
Set up alerts based on the generated signals to receive notifications when conditions are met 📲.
Use the gradient fill as additional context for market sentiment analysis.
LIMITATIONS
The indicator may generate false signals in highly volatile or ranging markets 🌪️.
Users should combine this indicator with other forms of analysis for more reliable trading decisions.
The effectiveness of the indicator may vary depending on the asset and timeframe being analyzed.
NOTES
Ensure that you have sufficient historical data available for accurate calculations.
Test the indicator thoroughly on demo accounts before applying it to live trading 🔍.
Customize the appearance and parameters as needed to fit your trading strategy.
הערות שחרור
█ OVERVIEWblackcat1402 L1 NinjaTrader Channel (NTC) is a volatility-adaptive price channel that combines Donchian-style band extremes with ATR-scaled deviation and a momentum heat-map fill. It flags close-confirmed BUY and SELL signals when price crosses its channel boundaries, and ships with a position state machine, ATR-based take-profit and stop-loss reference levels, a live dashboard and ready-to-use alerts.
█ CONCEPTS
• Channel engine: the midline averages the highest high and lowest low over the channel length (ta.highest, ta.lowest); bands sit one ATR multiple away (ta.atr), so the envelope breathes with volatility
• Momentum heat: an ALMA-smoothed RSI drives a 101-step blue-green-yellow-red gradient fill, so the channel interior glows hotter as momentum rises and cools as it fades
• Signal governance: a position state machine suppresses repeated same-direction signals and applies a user-defined cooldown between fires
• Risk reference: each entry records ATR-scaled stop-loss and take-profit levels that stay plotted until the trade closes
█ HOW TO USE
1 — Add the indicator to any chart; it adapts to every symbol and timeframe
2 — Tune Channel Length and Multiplier to control envelope width and reactivity
3 — Read BUY (green, below the bar) and SELL (red, above the bar) labels as close-confirmed boundary crosses
4 — Optional: create alerts from the four built-in alert conditions
Input Parameters
• Channel: Channel Length (20), Multiplier (2.0), Show Channel Midline
• Gradient Heat: ALMA Length (21), ALMA Offset (0.85), ALMA Sigma (6), RSI Smoothing Length (21)
• Signal Governance: Enable Signal Governance, Cooldown Bars (3, 0 = off)
• Risk Management: ATR Length (14), Stop Loss xATR (2.0), Take Profit xATR (3.0), Enable TP/SL Levels
• Visual: toggles for BUY/SELL labels, TP/SL exit marks, position background tint and dashboard
█ SIGNALS
Visual Elements
• BUY label (green, up arrow): close crossed back above the upper or lower band
• SELL label (red, down arrow): close crossed back below the lower or upper band
• TP / SL cross marks (orange): the open position's reference level was reached at bar close
• Background tint: soft green while long, soft red while short
• Dashboard (top right): position state, last signal, entry price, stop, target and ATR
• Fill color: momentum heat, from cold blue (weak) through green and yellow to hot red (strong)
█ FEATURES
• Close-confirmed signals — labels and alerts do not repaint after bar close
• Signal governance with cooldown cuts whipsaw signal clustering in choppy markets
• ATR-scaled TP/SL reference lines adapt automatically to each symbol's volatility
• Four alertcondition channels plus dynamic alert() messages that include the trigger price
• Every module (governance, risk levels, dashboard, tint, midline) can be toggled independently
█ IMPLEMENTATION NOTES
• Built-ins used: ta.highest, ta.lowest, ta.atr, ta.alma, ta.rsi
• Entries and exits are evaluated on confirmed bars only; alert() calls use freq_once_per_bar_close
• Set Enable Signal Governance off and Cooldown Bars to 0 to recover the raw legacy signal behavior of V1
█ LIMITATIONS
• Band-crossing logic performs best in trending markets; expect more false signals in tight ranges
• TP/SL levels are close-based visual references; intrabar execution prices may differ
• This is a technical analysis tool, not financial advice
█ NOTES
• Original concept by blackcat1402, published under the Mozilla Public License 2.0
• V2 additions: signal governance, ATR risk levels, exit marks, dashboard, background tint and alerts
• Feel free to use and modify — attribution appreciated
════════════════════════════════════════════════════════════════════════
For questions or feedback, please use the comments section below.

Don't miss out! The first and most important thing to do is to join my Discord chat now! Click here to start your adventure: discord.com/invite/ZTGpQJq My new github for more pine development soon: github.com/wxt-coder
כתב ויתור
המידע והפרסומים אינם מיועדים להיות, ואינם מהווים, ייעוץ או המלצה פיננסית, השקעתית, מסחרית או מכל סוג אחר המסופקת או מאושרת על ידי TradingView. קרא עוד ב־תנאי השימוש.
Don't miss out! The first and most important thing to do is to join my Discord chat now! Click here to start your adventure: discord.com/invite/ZTGpQJq My new github for more pine development soon: github.com/wxt-coder
כתב ויתור
המידע והפרסומים אינם מיועדים להיות, ואינם מהווים, ייעוץ או המלצה פיננסית, השקעתית, מסחרית או מכל סוג אחר המסופקת או מאושרת על ידי TradingView. קרא עוד ב־תנאי השימוש.