Bollinger Bands Asymmetry Attribution
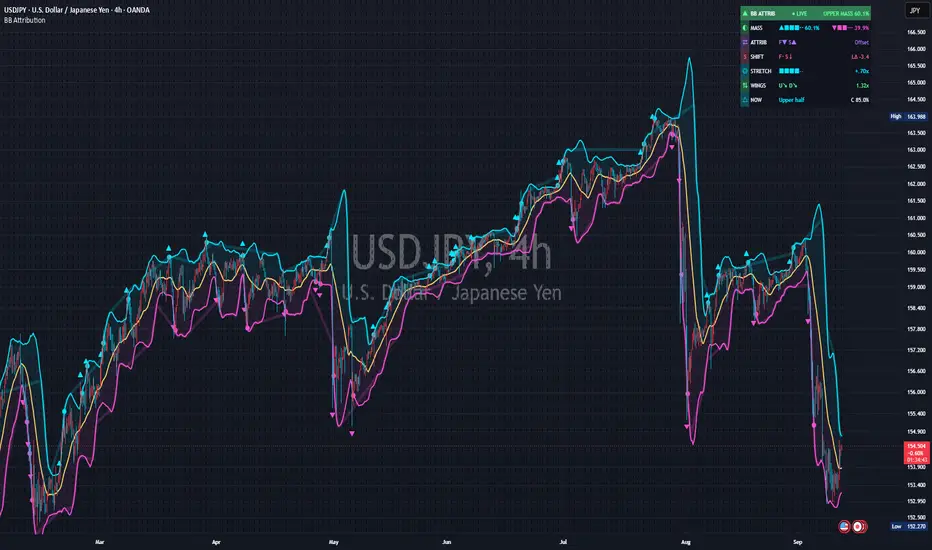
Bollinger Bands Asymmetry Attribution
Overview
Bollinger Bands Asymmetry Attribution is an open-source volatility-analysis overlay that studies how price dispersion is distributed above and below a selectable moving basis.
A conventional Bollinger Bands calculation uses one standard deviation to place symmetric upper and lower bands around a moving average. This script takes a different approach. It separates basis-relative squared deviations into upper-side and lower-side components, attributes the resulting directional dispersion to observation frequency and conditional excursion severity, and then constructs independently stabilized upper and lower wings.
The indicator is designed to answer questions such as:
- Is current dispersion concentrated above or below the basis?
- Is that asymmetry caused by price spending more observations on one side?
- Is it caused by fewer but larger excursions on one side?
- Are frequency and severity reinforcing each other or opposing each other?
- Is directional dispersion currently shifting, and which component is producing that shift?
- How stretched is the current source relative to the matching asymmetric wing?
This is a descriptive market-structure and volatility tool. It is not a trading strategy, directional forecast, reversal model, or buy/sell signal generator.
Core calculation
For each bar, the script evaluates the selected Source over the Attribution Length around the current selected basis.
For every observation in the rolling window:
Deviation = Observation - Current basis
Observations above the basis contribute to the upper squared-deviation mass.
Observations below the basis contribute to the lower squared-deviation mass.
Upper squared mass:
Sum of squared deviations where Deviation > 0
Lower squared mass:
Sum of squared deviations where Deviation < 0
The directional semivariances are then calculated across the entire observation window:
Upper semivariance = Upper squared mass / N
Lower semivariance = Lower squared mass / N
where N is the total number of valid observations in the window.
Frequency and severity attribution
Each directional semivariance can be factored exactly into two components.
For the upper side:
Upper occupancy = Upper observation count / N
Upper conditional severity =
Upper squared mass / Upper observation count
Upper semivariance =
Upper occupancy x Upper conditional severity
The same identity applies to the lower side.
In the readout:
F means observation frequency or occupancy.
S means conditional squared-excursion severity.
Frequency describes how often observations occurred on one side of the basis.
Severity describes how large the squared excursions were when observations occurred on that side.
This distinction allows two windows with similar directional semivariance to be interpreted differently.
For example:
- Frequent but relatively small upper deviations can produce upper-side dispersion.
- A small number of very large upper deviations can produce a similar amount of upper-side dispersion.
- Frequency and severity can both favor the same side.
- Frequency can favor one side while severity favors the other.
The raw mathematical identity is exact. For visual stability, the MASS, frequency, and severity diagnostics shown in the panel are smoothed independently. Therefore, the displayed smoothed values should be interpreted as stable diagnostics rather than as an algebraic identity between the visible numbers.
What makes this script different
The original contribution is not simply the use of different upper and lower band widths. Asymmetric volatility bands and directional semivariance concepts already exist.
This script extends the analysis by connecting four related layers in one coherent framework:
1. Directional dispersion mass
It measures how total basis-relative squared dispersion is divided between the upper and lower sides.
2. Level attribution
It separates each side's directional semivariance into:
- Observation frequency or occupancy
- Conditional squared-excursion severity
3. Mass Shift Attribution
It decomposes the one-bar change in directional semivariance into:
- A frequency-change contribution
- A severity-change contribution
4. Trader-facing geometry
It connects those attribution measurements to independently stabilized asymmetric wings, side-normalized stretch, wing motion, transition markers, and alerts.
The script does not combine unrelated oscillators, volume filters, trend scores, or multi-timeframe indicators. All principal outputs derive from the same basis-relative directional-dispersion framework.
Asymmetric wing construction
The primary upper and lower wings are not conventional symmetric Bollinger Bands.
The script first calculates the conditional variance for each side. When one side contains only a small number of observations, its conditional variance can become unstable or overly dependent on one data point.
To reduce this problem, the displayed geometry uses Sparse-Side Stabilization.
A side with fewer observations is partially shrunk toward the pooled variance of the full rolling window. A side with more observations retains more of its own conditional variance.
Conceptually:
Stabilized side variance =
Side weight x Side conditional variance
+
(1 - Side weight) x Pooled variance
The side weight increases with the number of observations on that side.
The stabilized upper and lower variances are converted into wing distances using their square roots, the Wing Multiplier, and optional RMA smoothing.
Upper wing = Basis + Stabilized upper distance
Lower wing = Basis - Stabilized lower distance
This stabilization affects the displayed wing geometry only. The underlying MASS, Frequency, Severity, and identity diagnostics remain based on the unshrunk directional statistics.
The optional Classic Symmetric Reference displays a conventional SMA-centered standard-deviation envelope for comparison. It is disabled by default to keep the publication chart clear.
Visual readout
The compact panel is organized into seven rows.
Header
The header shows:
- The script name
- LIVE or CLOSE execution status
- The current upper/lower dispersion-mass state
Examples:
UPPER MASS 60.2%
LOWER MASS 58.7%
MASS 51.0%/49.0%
The percentages are smoothed directional semivariance shares. They are not probabilities, expected returns, price targets, or forecasts.
MASS
MASS shows how directional semivariance is divided between the upper and lower sides.
The cyan value represents the upper share.
The magenta value represents the lower share.
The two displayed shares sum to 100%.
A larger upper share means that observations above the basis currently account for more of the smoothed basis-relative squared dispersion. A larger lower share means that observations below the basis account for more.
ATTRIB
ATTRIB describes the composition of the current asymmetry.
F = Observation frequency or occupancy
S = Conditional squared-excursion severity
The symbols have the following meanings:
F▲ = Frequency favors the upper side
F▼ = Frequency favors the lower side
F· = No material frequency bias
S▲ = Conditional severity favors the upper side
S▼ = Conditional severity favors the lower side
S· = No material severity bias
S? = Severity cannot be compared because one side has too few observations
The ATTRIB states are:
Balanced
Neither frequency nor severity exceeds the selected significance threshold.
Frequency
Observation frequency favors one side, while conditional severity is approximately balanced.
Severity
Conditional severity favors one side, while observation frequency is approximately balanced.
Reinforced
Frequency and severity favor the same side.
Offset
Frequency and severity favor opposite sides. One side may occur more often while the other side contains larger conditional excursions.
Sparse
One side does not contain enough observations for a reliable two-sided severity comparison.
No dispersion
The rolling window contains no meaningful basis-relative dispersion.
Warming
The required rolling history is not yet available.
SHIFT
SHIFT analyzes how directional dispersion changed from the previous bar to the current bar.
For either side:
Semivariance = Occupancy x Conditional severity
The one-bar product change is decomposed as:
Delta semivariance =
Delta occupancy x Average conditional severity
+
Delta conditional severity x Average occupancy
This midpoint formulation allocates the interaction between occupancy and severity equally, avoiding dependence on whether frequency or severity is applied first.
The script calculates this decomposition separately for the upper and lower sides, then evaluates the change in the upper-minus-lower directional semivariance difference.
In the SHIFT row:
F↑ means the frequency component is moving directional dispersion toward the upper side.
F↓ means the frequency component is moving directional dispersion toward the lower side.
S↑ means the severity component is moving directional dispersion toward the upper side.
S↓ means the severity component is moving directional dispersion toward the lower side.
A centered dot means the component is below the configured significance threshold.
Possible SHIFT states include:
Frequency upper or Frequency lower
The occupancy-change component is dominant.
Severity upper or Severity lower
The conditional-severity-change component is dominant.
Reinforced upper or Reinforced lower
Frequency and severity changes are both moving directional dispersion toward the same side.
Shared upper or Shared lower
Both components contribute in the same net direction without one meeting the configured dominance ratio.
Offset
Frequency and severity changes oppose each other.
Stable
The net normalized directional mass shift is below the selected threshold.
The displayed Delta value is normalized by the average total semivariance of the two compared windows. It is not a price percentage, return estimate, or directional probability.
STRETCH
STRETCH measures the current Source distance from the basis using the wing on the same side.
When Source is above the basis:
Stretch =
(Source - Basis) / Upper wing distance
When Source is below the basis:
Stretch =
-(Basis - Source) / Lower wing distance
Interpretation:
+1.00x = Source is at the upper wing
-1.00x = Source is at the lower wing
+0.50x = Source is halfway from the basis to the upper wing
-0.50x = Source is halfway from the basis to the lower wing
A value above +1.00x or below -1.00x means the selected Source is outside the corresponding asymmetric wing.
Stretch does not predict continuation or reversal. It only reports the current location relative to the side-specific dispersion geometry.
WINGS
WINGS shows the one-bar movement of the stabilized upper and lower wing distances.
U refers to the upper wing.
D refers to the lower wing.
Arrow meanings:
↗ = Expanding beyond the selected Wing Motion Threshold
↘ = Contracting beyond the selected Wing Motion Threshold
→ = Approximately stable
The ratio on the right is:
Upper wing distance / Lower wing distance
A ratio above 1.00 means the upper wing is wider.
A ratio below 1.00 means the lower wing is wider.
The ratio describes asymmetric geometry, not directional probability.
NOW
NOW reports the current side-normalized location or the most recent live transition preview.
Possible location states include:
- Upper outside
- Upper edge
- Upper half
- On basis
- Lower half
- Lower edge
- Lower outside
The C value is the realized rolling containment percentage.
Containment measures how often the selected Source was inside the displayed asymmetric wings over the configured Containment Lookback.
This is a backward-looking realized statistic. It is not a guaranteed future coverage probability.
How to use the indicator
A practical reading sequence is:
1. Read MASS
Determine whether basis-relative squared dispersion is currently concentrated more heavily above or below the basis.
2. Read ATTRIB
Determine whether the current asymmetry is associated primarily with:
- More observations on one side
- Larger excursions on one side
- Both factors reinforcing each other
- Opposing frequency and severity effects
- An insufficient side sample
3. Read SHIFT
Determine whether the directional dispersion difference is currently changing and whether frequency or severity is producing that change.
4. Read STRETCH
Locate the current Source relative to the corresponding asymmetric wing.
5. Read WINGS
Check whether the upper and lower dispersion envelopes are expanding, contracting, or remaining stable.
6. Read NOW and containment
Confirm the current location or transition and review how frequently the Source has historically remained inside the displayed wings.
Example interpretations:
UPPER MASS with Frequency attribution
Observations have occurred above the basis more often, but upper-side conditional excursion severity is not materially larger.
UPPER MASS with Severity attribution
Upper-side observations may not be more frequent, but their conditional squared excursions are larger.
UPPER MASS with Reinforced attribution
Both observation frequency and conditional severity favor the upper side.
UPPER MASS with Offset attribution
One component favors the upper side while the other favors the lower side. The total upper mass reflects the net result.
Upper mass with SHIFT moving lower
The current level remains upper-dominant, but the latest window change is moving directional dispersion back toward the lower side.
Balanced MASS with active SHIFT
The current upper/lower mass level is near balance, but the most recent change is moving that balance toward one side.
These readings provide context. They do not prescribe an entry, exit, stop, position size, or trade direction.
Markers
The script uses sparse transition markers rather than marking every bar outside a wing.
Triangle above a bar
The selected Source has moved from inside to outside the upper wing.
Triangle below a bar
The selected Source has moved from inside to outside the lower wing.
Circle on an upper or lower wing
The selected Source has returned inside after being outside that wing.
Diamond on the basis
The selected Source moved directly from outside one wing to outside the opposite wing. This is consolidated into one Cross-Wing Jump event so the same bar does not receive duplicate excursion and re-entry markers.
Optional dominance markers
These identify a confirmed transition into upper-mass or lower-mass dominance.
Markers describe transitions across the calculated geometry. They are not buy or sell signals and do not imply that price will reverse, continue, or reach a target.
Alerts
Alert conditions are available for:
- Upper asymmetric excursion started
- Lower asymmetric excursion started
- Upper asymmetric re-entry
- Lower asymmetric re-entry
- Direct cross-wing jump to the upper side
- Direct cross-wing jump to the lower side
- Upper semivariance-mass dominance started
- Lower semivariance-mass dominance started
Confirmed Events Only is enabled by default.
With this setting enabled, markers and alerts wait for the bar to close. The asymmetric wings and visual readout continue to update during the forming bar.
Main settings
Source
Selects the price or indicator series analyzed by the script.
Attribution Length
Sets the rolling observation window.
Basis Type
SMA is the conventional statistical-center setting.
EMA, RMA, and WMA are provided as basis-relative research alternatives. When one of these alternatives is selected, the directional partial moments are measured around that selected moving basis rather than around the arithmetic sample mean.
Wing Multiplier
Scales the upper and lower stabilized wing distances.
The multiplier is not a confidence level.
Sparse-Side Stabilization
Controls how strongly a side with few observations is shrunk toward pooled dispersion.
A value of zero disables shrinkage when that side contains observations.
Wing Smoothing
Applies RMA smoothing to the displayed wing distances.
Attribution Smoothing
Smooths MASS, Frequency, and Severity diagnostics to reduce one-bar flicker.
Dominance Entry and Release Thresholds
Create hysteresis around the upper-mass, balanced, and lower-mass states.
Minimum Observations Per Side
Sets the minimum sample required on both sides before Severity is compared.
Mass Shift Smoothing
Smooths the Frequency and Severity components of the one-bar SHIFT calculation.
Mass Shift Significance Threshold
Controls when a SHIFT component is displayed as materially active.
Mass Shift Driver Dominance Ratio
Controls how much larger one component must be before it is classified as the dominant SHIFT driver.
Edge Zone Starts At
Defines when STRETCH is considered near an upper or lower wing.
Containment Lookback
Sets the rolling window for realized containment.
Visual settings
Allow the user to control wing visibility, split fills, the optional state rail, dominant-wing glow, classic symmetric reference, line widths, transparency, colors, readout position, text size, and price-axis clearance.
Live-bar behavior
The script does not request higher-timeframe data, use lookahead logic, or intentionally access future bars.
Historical calculations use the chart's available data and the selected settings.
During the current forming bar:
- Wings can change
- MASS can change
- ATTRIB can change
- SHIFT can change
- STRETCH can change
- WINGS can change
- NOW can change
This is normal real-time indicator behavior.
When Confirmed Events Only is enabled, transition markers and alerts are recorded only after bar close. Disabling that setting allows intrabar events, which can appear and disappear before the bar closes.
Data Window outputs
The script provides research values in the Data Window, including:
- Semivariance Mass Bias
- Observation Frequency Bias
- Conditional Severity Bias
- Upper Semivariance Share
- Lower Semivariance Share
- Asymmetric Side-Normalized Stretch
- Upper Stabilized Wing Distance
- Lower Stabilized Wing Distance
- Realized Envelope Containment
- Side Sample Adequacy
- Smoothed Directional Mass Shift
- Flow Bridge Identity Residual
The Flow Bridge Identity Residual allows users to inspect the numerical consistency of the raw one-bar frequency/severity decomposition. Small non-zero values can occur because of floating-point arithmetic.
Limitations
This indicator is backward-looking and descriptive. It does not estimate the probability of future price direction, reversals, breakouts, continuation, or profitability.
The primary wings are not conventional Bollinger Bands and are not confidence intervals.
The Wing Multiplier does not imply a 68%, 95%, or 99% probability range.
Realized containment is calculated from past rolling observations and does not guarantee future containment.
The rolling statistics compare historical observations with the current selected basis for each calculation window. They do not compare every historical observation with the basis value that existed on that historical bar.
SMA provides the conventional arithmetic-center interpretation. EMA, RMA, and WMA create basis-relative research variants whose partial moments should not be interpreted as conventional sample semivariance around the arithmetic mean.
Conditional Severity requires observations on both sides. When one side does not meet the configured minimum sample, the script displays Sparse and S? instead of treating the missing comparison as neutral evidence.
Sparse-Side Stabilization intentionally modifies displayed wing geometry when a side has few observations. It does not modify the raw attribution statistics.
Smoothing reduces visual noise but introduces lag.
Results depend on the selected Source, length, basis, multiplier, thresholds, market, timeframe, and available data.
For conventional interpretation, use standard time-based charts. Synthetic chart types can change the input price series and therefore change calculations and alerts.
A movement outside a wing does not necessarily indicate overbought, oversold, exhaustion, breakout confirmation, reversal, or continuation.
This indicator should be used as an analytical context tool alongside the user's own market structure, execution, and risk-management process.
Open-source transparency
The script is published open-source so users can inspect the calculations, verify the attribution identities, review the stabilization logic, study the Data Window outputs, and modify the available research settings.
The indicator provides measurements and alerts only. It does not place orders, simulate performance, report a win rate, or guarantee trading results.
Overview
Bollinger Bands Asymmetry Attribution is an open-source volatility-analysis overlay that studies how price dispersion is distributed above and below a selectable moving basis.
A conventional Bollinger Bands calculation uses one standard deviation to place symmetric upper and lower bands around a moving average. This script takes a different approach. It separates basis-relative squared deviations into upper-side and lower-side components, attributes the resulting directional dispersion to observation frequency and conditional excursion severity, and then constructs independently stabilized upper and lower wings.
The indicator is designed to answer questions such as:
- Is current dispersion concentrated above or below the basis?
- Is that asymmetry caused by price spending more observations on one side?
- Is it caused by fewer but larger excursions on one side?
- Are frequency and severity reinforcing each other or opposing each other?
- Is directional dispersion currently shifting, and which component is producing that shift?
- How stretched is the current source relative to the matching asymmetric wing?
This is a descriptive market-structure and volatility tool. It is not a trading strategy, directional forecast, reversal model, or buy/sell signal generator.
Core calculation
For each bar, the script evaluates the selected Source over the Attribution Length around the current selected basis.
For every observation in the rolling window:
Deviation = Observation - Current basis
Observations above the basis contribute to the upper squared-deviation mass.
Observations below the basis contribute to the lower squared-deviation mass.
Upper squared mass:
Sum of squared deviations where Deviation > 0
Lower squared mass:
Sum of squared deviations where Deviation < 0
The directional semivariances are then calculated across the entire observation window:
Upper semivariance = Upper squared mass / N
Lower semivariance = Lower squared mass / N
where N is the total number of valid observations in the window.
Frequency and severity attribution
Each directional semivariance can be factored exactly into two components.
For the upper side:
Upper occupancy = Upper observation count / N
Upper conditional severity =
Upper squared mass / Upper observation count
Upper semivariance =
Upper occupancy x Upper conditional severity
The same identity applies to the lower side.
In the readout:
F means observation frequency or occupancy.
S means conditional squared-excursion severity.
Frequency describes how often observations occurred on one side of the basis.
Severity describes how large the squared excursions were when observations occurred on that side.
This distinction allows two windows with similar directional semivariance to be interpreted differently.
For example:
- Frequent but relatively small upper deviations can produce upper-side dispersion.
- A small number of very large upper deviations can produce a similar amount of upper-side dispersion.
- Frequency and severity can both favor the same side.
- Frequency can favor one side while severity favors the other.
The raw mathematical identity is exact. For visual stability, the MASS, frequency, and severity diagnostics shown in the panel are smoothed independently. Therefore, the displayed smoothed values should be interpreted as stable diagnostics rather than as an algebraic identity between the visible numbers.
What makes this script different
The original contribution is not simply the use of different upper and lower band widths. Asymmetric volatility bands and directional semivariance concepts already exist.
This script extends the analysis by connecting four related layers in one coherent framework:
1. Directional dispersion mass
It measures how total basis-relative squared dispersion is divided between the upper and lower sides.
2. Level attribution
It separates each side's directional semivariance into:
- Observation frequency or occupancy
- Conditional squared-excursion severity
3. Mass Shift Attribution
It decomposes the one-bar change in directional semivariance into:
- A frequency-change contribution
- A severity-change contribution
4. Trader-facing geometry
It connects those attribution measurements to independently stabilized asymmetric wings, side-normalized stretch, wing motion, transition markers, and alerts.
The script does not combine unrelated oscillators, volume filters, trend scores, or multi-timeframe indicators. All principal outputs derive from the same basis-relative directional-dispersion framework.
Asymmetric wing construction
The primary upper and lower wings are not conventional symmetric Bollinger Bands.
The script first calculates the conditional variance for each side. When one side contains only a small number of observations, its conditional variance can become unstable or overly dependent on one data point.
To reduce this problem, the displayed geometry uses Sparse-Side Stabilization.
A side with fewer observations is partially shrunk toward the pooled variance of the full rolling window. A side with more observations retains more of its own conditional variance.
Conceptually:
Stabilized side variance =
Side weight x Side conditional variance
+
(1 - Side weight) x Pooled variance
The side weight increases with the number of observations on that side.
The stabilized upper and lower variances are converted into wing distances using their square roots, the Wing Multiplier, and optional RMA smoothing.
Upper wing = Basis + Stabilized upper distance
Lower wing = Basis - Stabilized lower distance
This stabilization affects the displayed wing geometry only. The underlying MASS, Frequency, Severity, and identity diagnostics remain based on the unshrunk directional statistics.
The optional Classic Symmetric Reference displays a conventional SMA-centered standard-deviation envelope for comparison. It is disabled by default to keep the publication chart clear.
Visual readout
The compact panel is organized into seven rows.
Header
The header shows:
- The script name
- LIVE or CLOSE execution status
- The current upper/lower dispersion-mass state
Examples:
UPPER MASS 60.2%
LOWER MASS 58.7%
MASS 51.0%/49.0%
The percentages are smoothed directional semivariance shares. They are not probabilities, expected returns, price targets, or forecasts.
MASS
MASS shows how directional semivariance is divided between the upper and lower sides.
The cyan value represents the upper share.
The magenta value represents the lower share.
The two displayed shares sum to 100%.
A larger upper share means that observations above the basis currently account for more of the smoothed basis-relative squared dispersion. A larger lower share means that observations below the basis account for more.
ATTRIB
ATTRIB describes the composition of the current asymmetry.
F = Observation frequency or occupancy
S = Conditional squared-excursion severity
The symbols have the following meanings:
F▲ = Frequency favors the upper side
F▼ = Frequency favors the lower side
F· = No material frequency bias
S▲ = Conditional severity favors the upper side
S▼ = Conditional severity favors the lower side
S· = No material severity bias
S? = Severity cannot be compared because one side has too few observations
The ATTRIB states are:
Balanced
Neither frequency nor severity exceeds the selected significance threshold.
Frequency
Observation frequency favors one side, while conditional severity is approximately balanced.
Severity
Conditional severity favors one side, while observation frequency is approximately balanced.
Reinforced
Frequency and severity favor the same side.
Offset
Frequency and severity favor opposite sides. One side may occur more often while the other side contains larger conditional excursions.
Sparse
One side does not contain enough observations for a reliable two-sided severity comparison.
No dispersion
The rolling window contains no meaningful basis-relative dispersion.
Warming
The required rolling history is not yet available.
SHIFT
SHIFT analyzes how directional dispersion changed from the previous bar to the current bar.
For either side:
Semivariance = Occupancy x Conditional severity
The one-bar product change is decomposed as:
Delta semivariance =
Delta occupancy x Average conditional severity
+
Delta conditional severity x Average occupancy
This midpoint formulation allocates the interaction between occupancy and severity equally, avoiding dependence on whether frequency or severity is applied first.
The script calculates this decomposition separately for the upper and lower sides, then evaluates the change in the upper-minus-lower directional semivariance difference.
In the SHIFT row:
F↑ means the frequency component is moving directional dispersion toward the upper side.
F↓ means the frequency component is moving directional dispersion toward the lower side.
S↑ means the severity component is moving directional dispersion toward the upper side.
S↓ means the severity component is moving directional dispersion toward the lower side.
A centered dot means the component is below the configured significance threshold.
Possible SHIFT states include:
Frequency upper or Frequency lower
The occupancy-change component is dominant.
Severity upper or Severity lower
The conditional-severity-change component is dominant.
Reinforced upper or Reinforced lower
Frequency and severity changes are both moving directional dispersion toward the same side.
Shared upper or Shared lower
Both components contribute in the same net direction without one meeting the configured dominance ratio.
Offset
Frequency and severity changes oppose each other.
Stable
The net normalized directional mass shift is below the selected threshold.
The displayed Delta value is normalized by the average total semivariance of the two compared windows. It is not a price percentage, return estimate, or directional probability.
STRETCH
STRETCH measures the current Source distance from the basis using the wing on the same side.
When Source is above the basis:
Stretch =
(Source - Basis) / Upper wing distance
When Source is below the basis:
Stretch =
-(Basis - Source) / Lower wing distance
Interpretation:
+1.00x = Source is at the upper wing
-1.00x = Source is at the lower wing
+0.50x = Source is halfway from the basis to the upper wing
-0.50x = Source is halfway from the basis to the lower wing
A value above +1.00x or below -1.00x means the selected Source is outside the corresponding asymmetric wing.
Stretch does not predict continuation or reversal. It only reports the current location relative to the side-specific dispersion geometry.
WINGS
WINGS shows the one-bar movement of the stabilized upper and lower wing distances.
U refers to the upper wing.
D refers to the lower wing.
Arrow meanings:
↗ = Expanding beyond the selected Wing Motion Threshold
↘ = Contracting beyond the selected Wing Motion Threshold
→ = Approximately stable
The ratio on the right is:
Upper wing distance / Lower wing distance
A ratio above 1.00 means the upper wing is wider.
A ratio below 1.00 means the lower wing is wider.
The ratio describes asymmetric geometry, not directional probability.
NOW
NOW reports the current side-normalized location or the most recent live transition preview.
Possible location states include:
- Upper outside
- Upper edge
- Upper half
- On basis
- Lower half
- Lower edge
- Lower outside
The C value is the realized rolling containment percentage.
Containment measures how often the selected Source was inside the displayed asymmetric wings over the configured Containment Lookback.
This is a backward-looking realized statistic. It is not a guaranteed future coverage probability.
How to use the indicator
A practical reading sequence is:
1. Read MASS
Determine whether basis-relative squared dispersion is currently concentrated more heavily above or below the basis.
2. Read ATTRIB
Determine whether the current asymmetry is associated primarily with:
- More observations on one side
- Larger excursions on one side
- Both factors reinforcing each other
- Opposing frequency and severity effects
- An insufficient side sample
3. Read SHIFT
Determine whether the directional dispersion difference is currently changing and whether frequency or severity is producing that change.
4. Read STRETCH
Locate the current Source relative to the corresponding asymmetric wing.
5. Read WINGS
Check whether the upper and lower dispersion envelopes are expanding, contracting, or remaining stable.
6. Read NOW and containment
Confirm the current location or transition and review how frequently the Source has historically remained inside the displayed wings.
Example interpretations:
UPPER MASS with Frequency attribution
Observations have occurred above the basis more often, but upper-side conditional excursion severity is not materially larger.
UPPER MASS with Severity attribution
Upper-side observations may not be more frequent, but their conditional squared excursions are larger.
UPPER MASS with Reinforced attribution
Both observation frequency and conditional severity favor the upper side.
UPPER MASS with Offset attribution
One component favors the upper side while the other favors the lower side. The total upper mass reflects the net result.
Upper mass with SHIFT moving lower
The current level remains upper-dominant, but the latest window change is moving directional dispersion back toward the lower side.
Balanced MASS with active SHIFT
The current upper/lower mass level is near balance, but the most recent change is moving that balance toward one side.
These readings provide context. They do not prescribe an entry, exit, stop, position size, or trade direction.
Markers
The script uses sparse transition markers rather than marking every bar outside a wing.
Triangle above a bar
The selected Source has moved from inside to outside the upper wing.
Triangle below a bar
The selected Source has moved from inside to outside the lower wing.
Circle on an upper or lower wing
The selected Source has returned inside after being outside that wing.
Diamond on the basis
The selected Source moved directly from outside one wing to outside the opposite wing. This is consolidated into one Cross-Wing Jump event so the same bar does not receive duplicate excursion and re-entry markers.
Optional dominance markers
These identify a confirmed transition into upper-mass or lower-mass dominance.
Markers describe transitions across the calculated geometry. They are not buy or sell signals and do not imply that price will reverse, continue, or reach a target.
Alerts
Alert conditions are available for:
- Upper asymmetric excursion started
- Lower asymmetric excursion started
- Upper asymmetric re-entry
- Lower asymmetric re-entry
- Direct cross-wing jump to the upper side
- Direct cross-wing jump to the lower side
- Upper semivariance-mass dominance started
- Lower semivariance-mass dominance started
Confirmed Events Only is enabled by default.
With this setting enabled, markers and alerts wait for the bar to close. The asymmetric wings and visual readout continue to update during the forming bar.
Main settings
Source
Selects the price or indicator series analyzed by the script.
Attribution Length
Sets the rolling observation window.
Basis Type
SMA is the conventional statistical-center setting.
EMA, RMA, and WMA are provided as basis-relative research alternatives. When one of these alternatives is selected, the directional partial moments are measured around that selected moving basis rather than around the arithmetic sample mean.
Wing Multiplier
Scales the upper and lower stabilized wing distances.
The multiplier is not a confidence level.
Sparse-Side Stabilization
Controls how strongly a side with few observations is shrunk toward pooled dispersion.
A value of zero disables shrinkage when that side contains observations.
Wing Smoothing
Applies RMA smoothing to the displayed wing distances.
Attribution Smoothing
Smooths MASS, Frequency, and Severity diagnostics to reduce one-bar flicker.
Dominance Entry and Release Thresholds
Create hysteresis around the upper-mass, balanced, and lower-mass states.
Minimum Observations Per Side
Sets the minimum sample required on both sides before Severity is compared.
Mass Shift Smoothing
Smooths the Frequency and Severity components of the one-bar SHIFT calculation.
Mass Shift Significance Threshold
Controls when a SHIFT component is displayed as materially active.
Mass Shift Driver Dominance Ratio
Controls how much larger one component must be before it is classified as the dominant SHIFT driver.
Edge Zone Starts At
Defines when STRETCH is considered near an upper or lower wing.
Containment Lookback
Sets the rolling window for realized containment.
Visual settings
Allow the user to control wing visibility, split fills, the optional state rail, dominant-wing glow, classic symmetric reference, line widths, transparency, colors, readout position, text size, and price-axis clearance.
Live-bar behavior
The script does not request higher-timeframe data, use lookahead logic, or intentionally access future bars.
Historical calculations use the chart's available data and the selected settings.
During the current forming bar:
- Wings can change
- MASS can change
- ATTRIB can change
- SHIFT can change
- STRETCH can change
- WINGS can change
- NOW can change
This is normal real-time indicator behavior.
When Confirmed Events Only is enabled, transition markers and alerts are recorded only after bar close. Disabling that setting allows intrabar events, which can appear and disappear before the bar closes.
Data Window outputs
The script provides research values in the Data Window, including:
- Semivariance Mass Bias
- Observation Frequency Bias
- Conditional Severity Bias
- Upper Semivariance Share
- Lower Semivariance Share
- Asymmetric Side-Normalized Stretch
- Upper Stabilized Wing Distance
- Lower Stabilized Wing Distance
- Realized Envelope Containment
- Side Sample Adequacy
- Smoothed Directional Mass Shift
- Flow Bridge Identity Residual
The Flow Bridge Identity Residual allows users to inspect the numerical consistency of the raw one-bar frequency/severity decomposition. Small non-zero values can occur because of floating-point arithmetic.
Limitations
This indicator is backward-looking and descriptive. It does not estimate the probability of future price direction, reversals, breakouts, continuation, or profitability.
The primary wings are not conventional Bollinger Bands and are not confidence intervals.
The Wing Multiplier does not imply a 68%, 95%, or 99% probability range.
Realized containment is calculated from past rolling observations and does not guarantee future containment.
The rolling statistics compare historical observations with the current selected basis for each calculation window. They do not compare every historical observation with the basis value that existed on that historical bar.
SMA provides the conventional arithmetic-center interpretation. EMA, RMA, and WMA create basis-relative research variants whose partial moments should not be interpreted as conventional sample semivariance around the arithmetic mean.
Conditional Severity requires observations on both sides. When one side does not meet the configured minimum sample, the script displays Sparse and S? instead of treating the missing comparison as neutral evidence.
Sparse-Side Stabilization intentionally modifies displayed wing geometry when a side has few observations. It does not modify the raw attribution statistics.
Smoothing reduces visual noise but introduces lag.
Results depend on the selected Source, length, basis, multiplier, thresholds, market, timeframe, and available data.
For conventional interpretation, use standard time-based charts. Synthetic chart types can change the input price series and therefore change calculations and alerts.
A movement outside a wing does not necessarily indicate overbought, oversold, exhaustion, breakout confirmation, reversal, or continuation.
This indicator should be used as an analytical context tool alongside the user's own market structure, execution, and risk-management process.
Open-source transparency
The script is published open-source so users can inspect the calculations, verify the attribution identities, review the stabilization logic, study the Data Window outputs, and modify the available research settings.
The indicator provides measurements and alerts only. It does not place orders, simulate performance, report a win rate, or guarantee trading results.

כתב ויתור
המידע והפרסומים אינם מיועדים להיות, ואינם מהווים, ייעוץ או המלצה פיננסית, השקעתית, מסחרית או מכל סוג אחר המסופקת או מאושרת על ידי TradingView. קרא עוד ב־תנאי השימוש.
כתב ויתור
המידע והפרסומים אינם מיועדים להיות, ואינם מהווים, ייעוץ או המלצה פיננסית, השקעתית, מסחרית או מכל סוג אחר המסופקת או מאושרת על ידי TradingView. קרא עוד ב־תנאי השימוש.