Seasonal Radar (chiefwils0n)
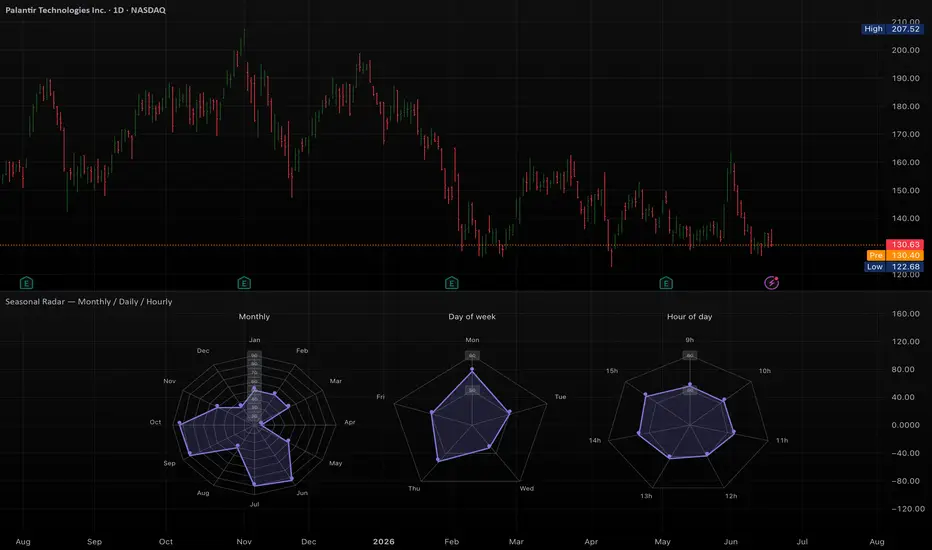
⚪️ Seasonal Radar — Monthly / Daily / Hourly
Three seasonality radars on one pane, each plotting the same metric — the percentage of periods that closed up — across a different cyclical bucket:
Reading outward from the center means a bucket closed up more often; a spoke pulled toward the middle means it closed up less often. At a glance you can see which months, weekdays, and hours have historically leaned bullish for the symbol on your chart.
Run this on a Daily chart. The indicator will prompt you if it's loaded on any other timeframe. The monthly radar samples a monthly context, the day-of-week radar counts the chart's own daily bars, and the hour-of-day radar reads 60-minute bars. Empty buckets — weekends for equities, off-session hours — are dropped automatically, so each radar only shows spokes for periods that have data.
⚪️ Inputs
⚪️ Notes
This is a descriptive, historical tool — it summarizes how often price has closed up in each bucket over the available sample. It is not predictive and makes no forward-looking claim. Smaller samples (especially limited intraday history) produce noisier readings, so weight the monthly and daily radars more heavily than the hourly one on symbols with shallow data.
Three seasonality radars on one pane, each plotting the same metric — the percentage of periods that closed up — across a different cyclical bucket:
- Monthly — by month of the year (Jan–Dec)
- Day of week — by weekday, sized to whatever the symbol actually trades
- Hour of day — by hour, pulled from intraday data
Reading outward from the center means a bucket closed up more often; a spoke pulled toward the middle means it closed up less often. At a glance you can see which months, weekdays, and hours have historically leaned bullish for the symbol on your chart.
Run this on a Daily chart. The indicator will prompt you if it's loaded on any other timeframe. The monthly radar samples a monthly context, the day-of-week radar counts the chart's own daily bars, and the hour-of-day radar reads 60-minute bars. Empty buckets — weekends for equities, off-session hours — are dropped automatically, so each radar only shows spokes for periods that have data.
⚪️ Inputs
- Monthly start year — where the month-of-year count begins. Day and hour radars use all available history (note: TradingView limits how far back intraday history goes).
- Web width (bars) — horizontal size of each radar. Pine can't read the pane's pixel aspect ratio, so nudge this until the rings look circular.
- Axis scaling — choose how the radial axis is fit:
- Auto (per radar) — each web fits its own data range; best when month, day, and hour sit in different bands.
- Auto (shared) — one range across all three so levels are directly comparable side by side.
- Manual — fixed min (center) and max (outer ring).
- Ring step % — spacing of the concentric gridlines.
- Colors — plot line, fill, and grid/spokes.
⚪️ Notes
This is a descriptive, historical tool — it summarizes how often price has closed up in each bucket over the available sample. It is not predictive and makes no forward-looking claim. Smaller samples (especially limited intraday history) produce noisier readings, so weight the monthly and daily radars more heavily than the hourly one on symbols with shallow data.

כתב ויתור
המידע והפרסומים אינם מיועדים להיות, ואינם מהווים, ייעוץ או המלצה פיננסית, השקעתית, מסחרית או מכל סוג אחר המסופקת או מאושרת על ידי TradingView. קרא עוד ב־תנאי השימוש.
כתב ויתור
המידע והפרסומים אינם מיועדים להיות, ואינם מהווים, ייעוץ או המלצה פיננסית, השקעתית, מסחרית או מכל סוג אחר המסופקת או מאושרת על ידי TradingView. קרא עוד ב־תנאי השימוש.