PAC CRT Indicator (MTF Scanner + Alerts)
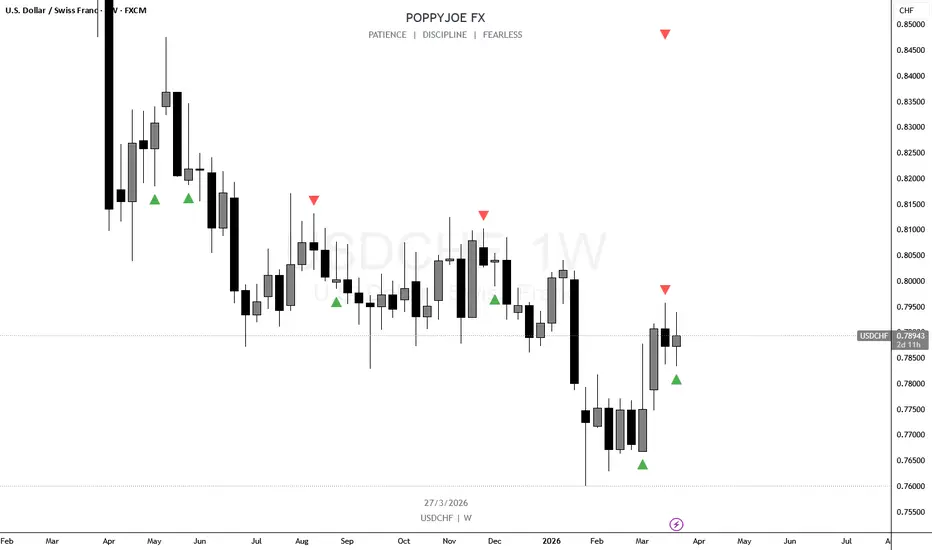
**CRT Indicator (Candle Range Trading) – Multi-Timeframe Scanner & Alerts**
The CRT Indicator is designed to identify high-probability Candle Range Trading (CRT) patterns directly on your chart. It detects both bullish and bearish setups using a precise two-candle formation and enhances decision-making by scanning multiple timeframes simultaneously.
---
### 🔍 What This Indicator Does
This script analyzes price action using two consecutive candles to identify CRT patterns where price manipulates beyond a previous candle’s range and closes back within it.
It automatically:
* Detects **Bullish CRT patterns**
* Detects **Bearish CRT patterns**
* Scans across multiple timeframes (M5, M15, H1, H4)
* Provides real-time **alert notifications**
---
### 📈 CRT Pattern Logic
**Bullish CRT Setup:**
* First candle is bearish
* Second candle is bullish
* Second candle sweeps below the first candle’s low
* Closing price returns within the first candle’s range
**Bearish CRT Setup:**
* First candle is bullish
* Second candle is bearish
* Second candle sweeps above the first candle’s high
* Closing price returns within the first
The CRT Indicator is designed to identify high-probability Candle Range Trading (CRT) patterns directly on your chart. It detects both bullish and bearish setups using a precise two-candle formation and enhances decision-making by scanning multiple timeframes simultaneously.
---
### 🔍 What This Indicator Does
This script analyzes price action using two consecutive candles to identify CRT patterns where price manipulates beyond a previous candle’s range and closes back within it.
It automatically:
* Detects **Bullish CRT patterns**
* Detects **Bearish CRT patterns**
* Scans across multiple timeframes (M5, M15, H1, H4)
* Provides real-time **alert notifications**
---
### 📈 CRT Pattern Logic
**Bullish CRT Setup:**
* First candle is bearish
* Second candle is bullish
* Second candle sweeps below the first candle’s low
* Closing price returns within the first candle’s range
**Bearish CRT Setup:**
* First candle is bullish
* Second candle is bearish
* Second candle sweeps above the first candle’s high
* Closing price returns within the first

כתב ויתור
המידע והפרסומים אינם מיועדים להיות, ואינם מהווים, ייעוץ או המלצה פיננסית, השקעתית, מסחרית או מכל סוג אחר המסופקת או מאושרת על ידי TradingView. קרא עוד ב־תנאי השימוש.
כתב ויתור
המידע והפרסומים אינם מיועדים להיות, ואינם מהווים, ייעוץ או המלצה פיננסית, השקעתית, מסחרית או מכל סוג אחר המסופקת או מאושרת על ידי TradingView. קרא עוד ב־תנאי השימוש.